Copyright
©The Author(s) 2019.
World J Hepatol. Nov 27, 2019; 11(11): 743-751
Published online Nov 27, 2019. doi: 10.4254/wjh.v11.i11.743
Published online Nov 27, 2019. doi: 10.4254/wjh.v11.i11.743
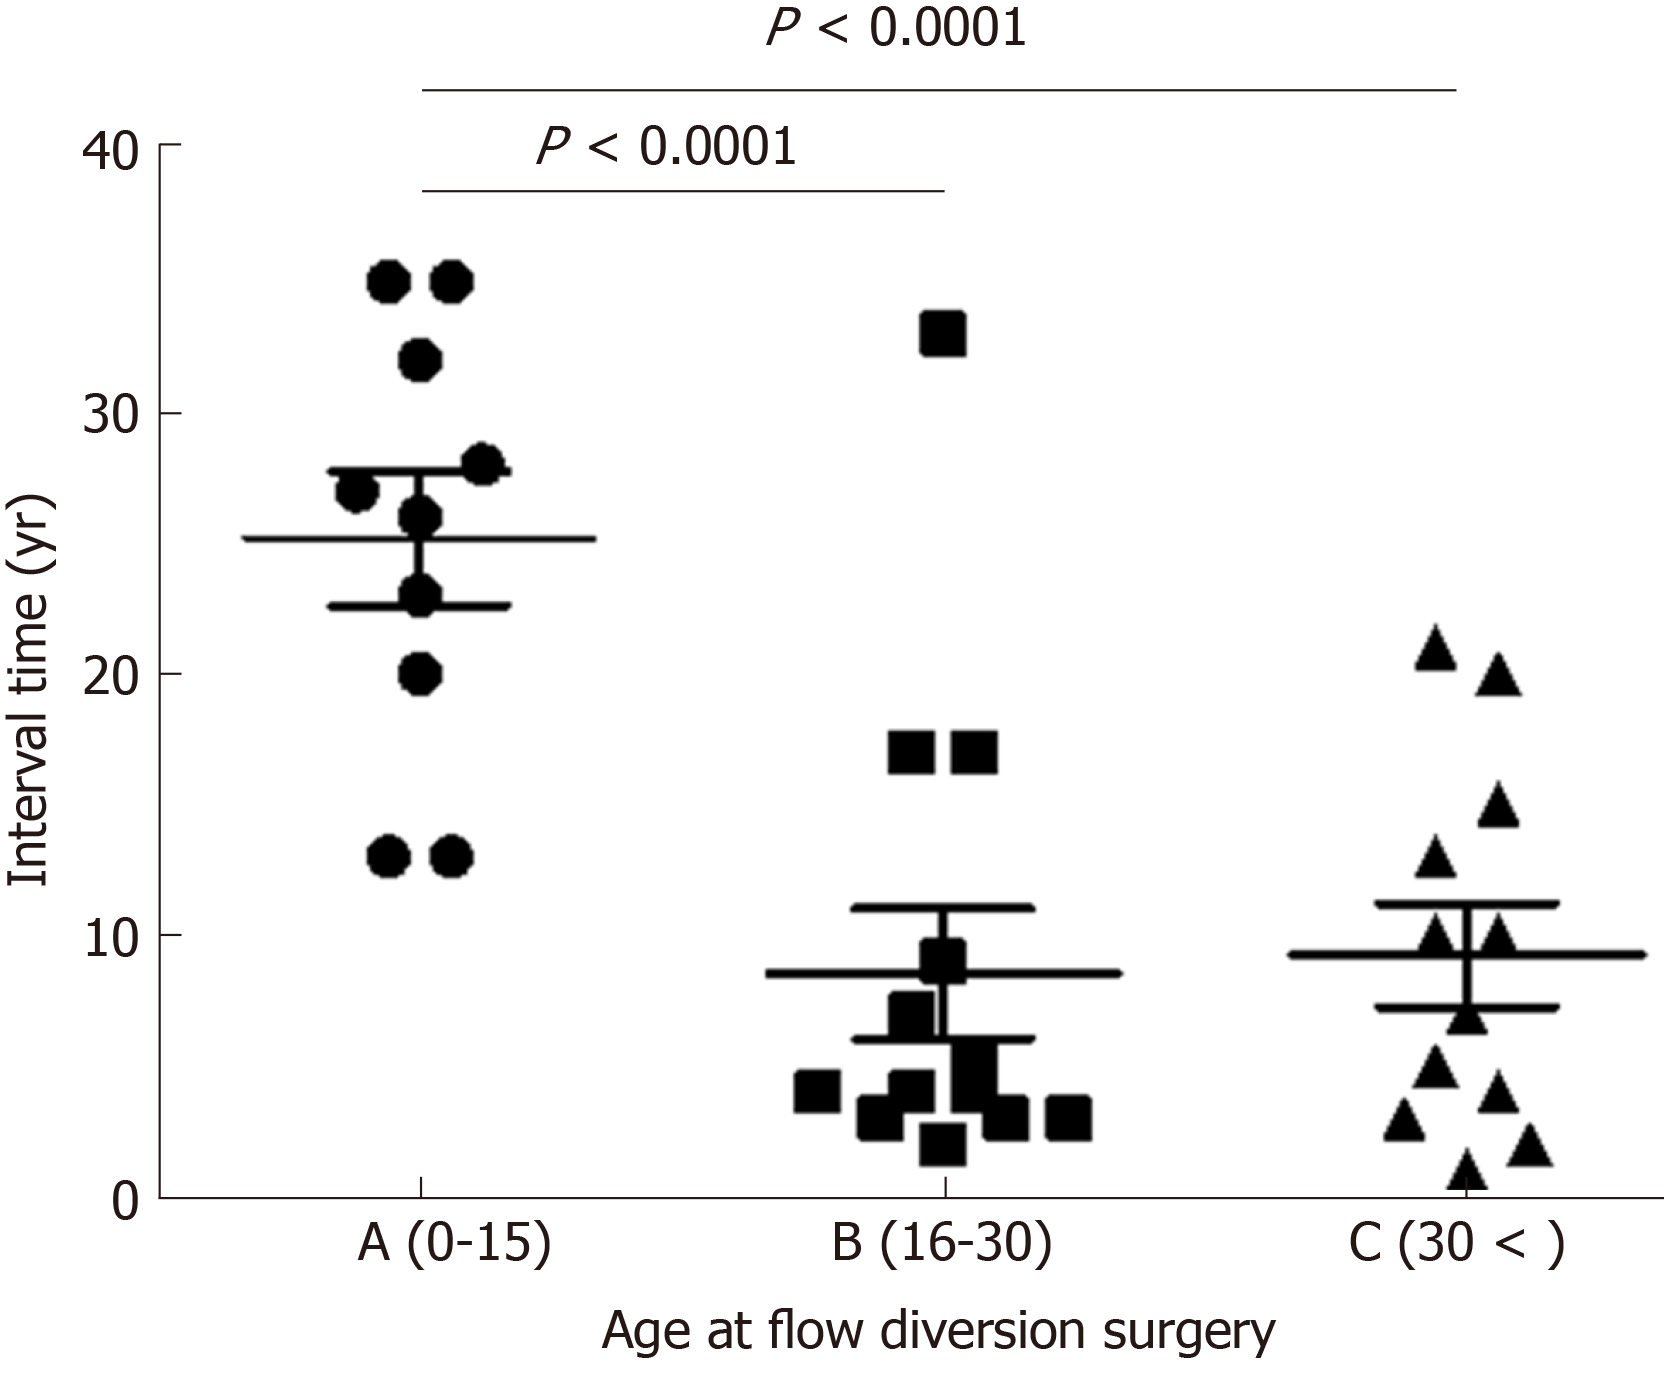
Figure 5 The graph shows the relationship between age at diversion surgery and interval time.
Data represent means and standard deviation. P < 0.0001, one-way analysis of variance and Bonferroni’s multiple comparison test.
- Citation: Ataka R, Ito T, Masui T, Seo S, Ishii T, Ogiso S, Yagi S, Taura K, Uemoto S. Cholangiocarcinoma after flow diversion surgery for congenital biliary dilatation: A case report and review of literature. World J Hepatol 2019; 11(11): 743-751
- URL: https://www.wjgnet.com/1948-5182/full/v11/i11/743.htm
- DOI: https://dx.doi.org/10.4254/wjh.v11.i11.743


