Copyright
©The Author(s) 2018.
World J Hepatol. Jan 27, 2018; 10(1): 22-33
Published online Jan 27, 2018. doi: 10.4254/wjh.v10.i1.22
Published online Jan 27, 2018. doi: 10.4254/wjh.v10.i1.22
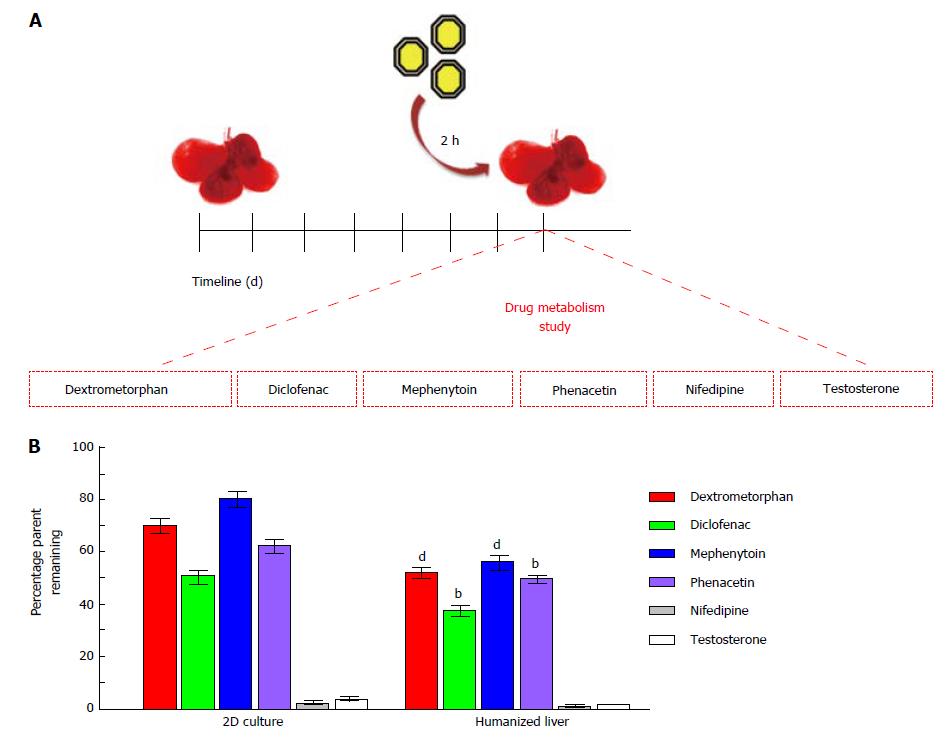
Figure 6 Drug metabolism studies using 3D humanized liver system.
A: Schematic representation showing the timeline of humanized liver development and drug metabolism study; B: Bar graphs showing the rate of cellular metabolism of six cytochrome P-450 probe substrates in humanized liver as compared to 2D-culture system (bP < 0.01, dP < 0.001).
- Citation: Vishwakarma SK, Bardia A, Lakkireddy C, Nagarapu R, Habeeb MA, Khan AA. Bioengineered humanized livers as better three-dimensional drug testing model system. World J Hepatol 2018; 10(1): 22-33
- URL: https://www.wjgnet.com/1948-5182/full/v10/i1/22.htm
- DOI: https://dx.doi.org/10.4254/wjh.v10.i1.22


