Copyright
©The Author(s) 2018.
World J Hepatol. Jan 27, 2018; 10(1): 22-33
Published online Jan 27, 2018. doi: 10.4254/wjh.v10.i1.22
Published online Jan 27, 2018. doi: 10.4254/wjh.v10.i1.22
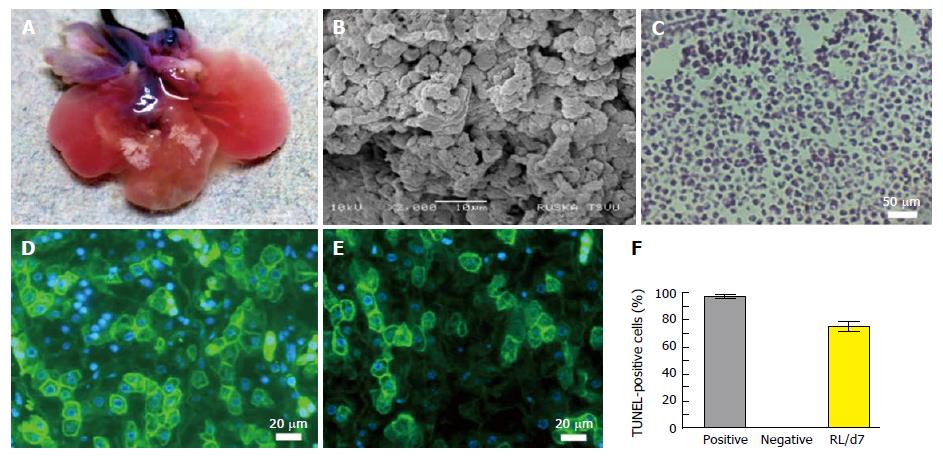
Figure 4 Characterization of humanized liver.
A: Optical image of humanized liver after 7 d of repopulation with human HPCs into a customized bioreactor; B: SEM image of humanized liver at day 7 showing cellular proliferation and natural arrangements; C: H and E staining of thin micro-section of humanized liver (Magnification: 10 ×); Albumin (D) and G6PC (E) immunofluorescence staining (green) representing the functional activity of repopulated human liver cells (Magnification: 20 ×); F: TUNEL staining of repopulated cells at day 7 (RL/d7) showed significantly high expression as compared with the negative control. SEM: Scanning electron microscopy.
- Citation: Vishwakarma SK, Bardia A, Lakkireddy C, Nagarapu R, Habeeb MA, Khan AA. Bioengineered humanized livers as better three-dimensional drug testing model system. World J Hepatol 2018; 10(1): 22-33
- URL: https://www.wjgnet.com/1948-5182/full/v10/i1/22.htm
- DOI: https://dx.doi.org/10.4254/wjh.v10.i1.22


