Copyright
©The Author(s) 2018.
World J Hepatol. Jan 27, 2018; 10(1): 166-171
Published online Jan 27, 2018. doi: 10.4254/wjh.v10.i1.166
Published online Jan 27, 2018. doi: 10.4254/wjh.v10.i1.166
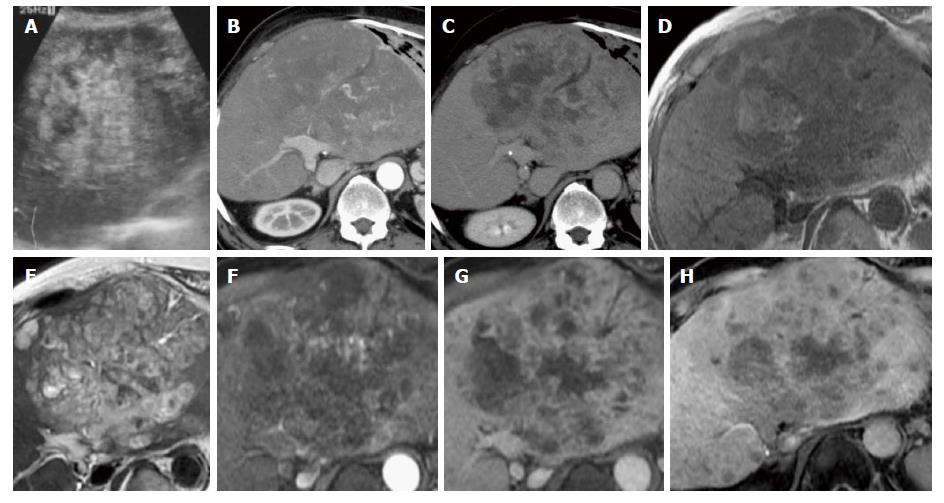
Figure 1 Abdominal ultrasonography.
A: B-mode ultrasonography; B: Arterial phase; C: Venous phase images obtained using contrast-enhanced computed tomography; D: T1-weighted phase; E: T2-weighted phase; F: Arterial phase; G: Venous phase; H: Hepatobiliary phase images obtained using gadolinium ethoxybenzyl-diethylenetriamine-enhanced magnetic resonance imaging. In the hepatobiliary phase, the tumor showed slightly elevated intensity, a finding that suggested uptake of gadolinium-ethoxybenzyl-diethylenetriamine pentaacetic acid in the tumor.
- Citation: Hayashi M, Kawana S, Sekino H, Abe K, Matsuoka N, Kashiwagi M, Okai K, Kanno Y, Takahashi A, Ito H, Hashimoto Y, Ohira H. Contrast uptake in primary hepatic angiosarcoma on gadolinium-ethoxybenzyl-diethylenetriamine pentaacetic acid-enhanced magnetic resonance imaging in the hepatobiliary phase. World J Hepatol 2018; 10(1): 166-171
- URL: https://www.wjgnet.com/1948-5182/full/v10/i1/166.htm
- DOI: https://dx.doi.org/10.4254/wjh.v10.i1.166


