Copyright
©The Author(s) 2018.
World J Hepatol. Jan 27, 2018; 10(1): 105-115
Published online Jan 27, 2018. doi: 10.4254/wjh.v10.i1.105
Published online Jan 27, 2018. doi: 10.4254/wjh.v10.i1.105
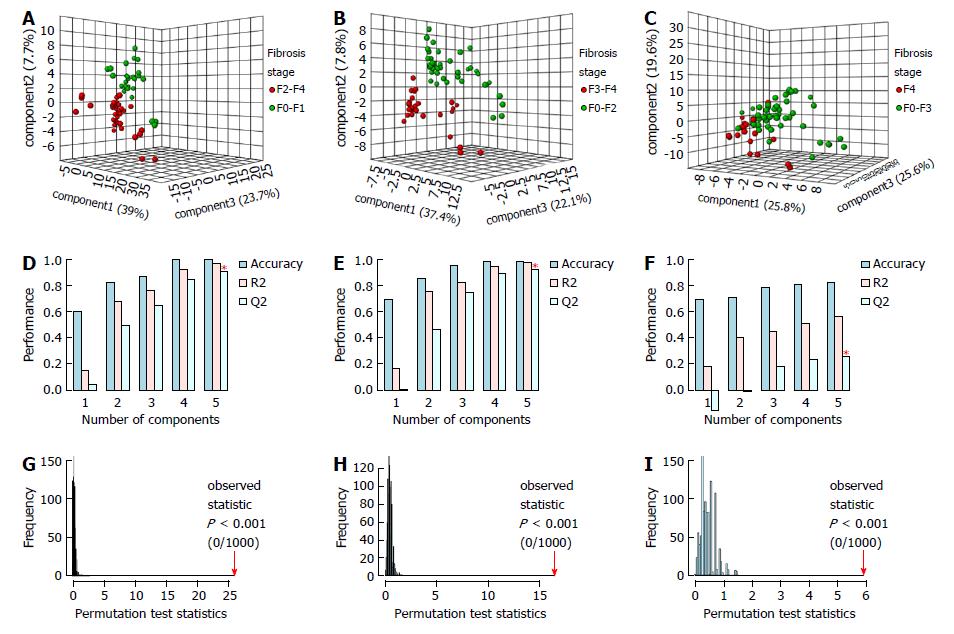
Figure 1 Partial least squares discriminant analysis metabonomic models to predict significant fibrosis (A, D, G) advanced fibrosis (B, E, H) and cirrhosis (C, F, I) in 69 chronic hepatitis C patients from Pernambuco/Brazil.
Three-dimensional score plot (A, B, C). Classification of MM using different numbers of latent components, with accuracy = 1.0/ 1.0/ 0.84, R2 = 0.98/ 0.98/ 0.56 and Q2 = 0.91/ 0.93/ 0.27, using 5 latent components (D, E, F); permutation tests statistics for 1000 permutations with observed statistic at P < 0.001 (G, H, I). MM: Metabonomic models.
- Citation: Batista AD, Barros CJP, Costa TBBC, Godoy MMG, Silva RD, Santos JC, de Melo Lira MM, Jucá NT, Lopes EPA, Silva RO. Proton nuclear magnetic resonance-based metabonomic models for non-invasive diagnosis of liver fibrosis in chronic hepatitis C: Optimizing the classification of intermediate fibrosis. World J Hepatol 2018; 10(1): 105-115
- URL: https://www.wjgnet.com/1948-5182/full/v10/i1/105.htm
- DOI: https://dx.doi.org/10.4254/wjh.v10.i1.105


