Copyright
©2010 Baishideng.
World J Hepatol. Jun 27, 2010; 2(6): 246-250
Published online Jun 27, 2010. doi: 10.4254/wjh.v2.i6.246
Published online Jun 27, 2010. doi: 10.4254/wjh.v2.i6.246
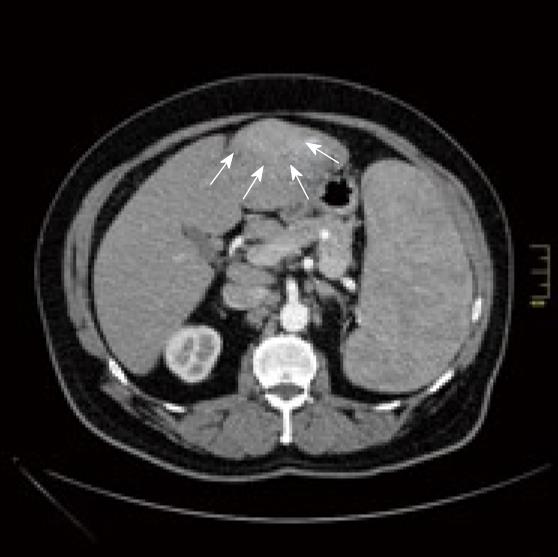
Figure 1 Contrast-computed tomographic (CT) scan shows a hyperdense (hypervascularised) lesion in the left lateral liver section, appearing hyperattenuating in the early arterial phase of contrast enhanced CT.
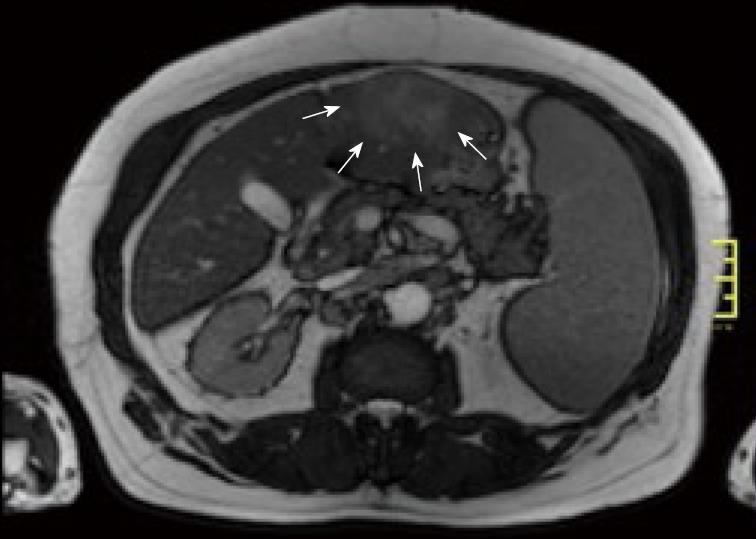
Figure 2 Magnetic resonance imaging shows an early enhancing mass in the left lateral segments of the liver.
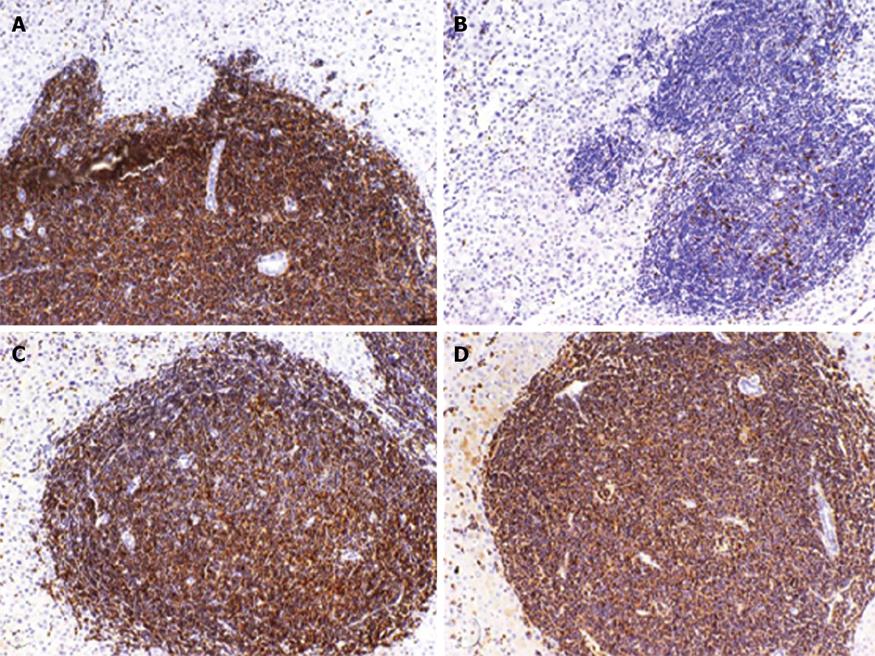
Figure 3 Immunohistochemical examination of the atypical small lymphocytic infiltrate in portal tracts.
A: CD20; B: CD3; C: CD5; D: CD23.
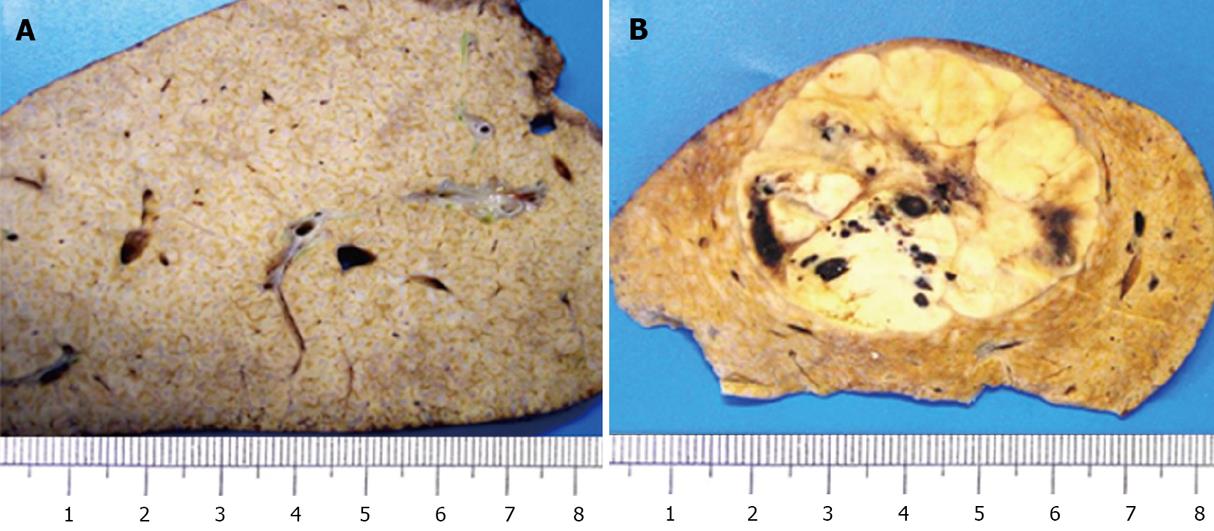
Figure 4 Macroscopical view of the liver parenchyma and the tumor mass.
A: Macroscopically liver parenchyma shows prominent enhanced greyish portal tracts; B: An at most 4.8 cm measuring tumorous nodular lesion.
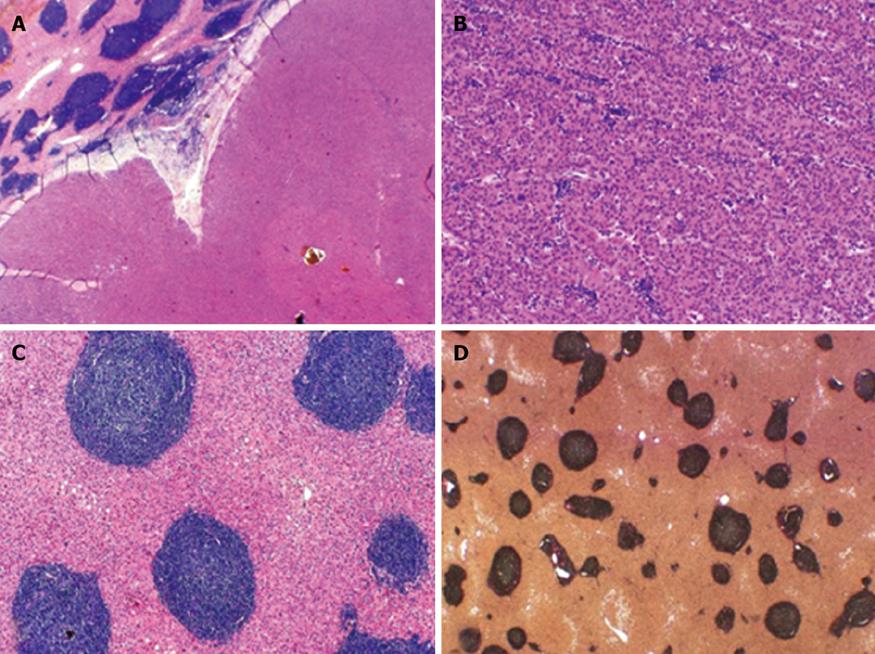
Figure 5 Histological specimen.
A: Border of non-neoplastic liver parenchyma (upper left) and hepatocellular carcinoma (HCC) (lower right); B: Trabecular configured HCC with atypical lymphocytic infiltration by the B-cell lineage (B-CLL); C: Portal tracts are rounded and show an atypical dense lymphocytic infiltration by B-CLL; D: There is neither significant fibrosis nor cirrhosis in liver parenchyma (van Gieson stain).
- Citation: Heidecke S, Stippel DL, Hoelscher AH, Wedemeyer I, Dienes HP, Drebber U. Simultaneous occurrence of a hepatocellular carcinoma and a hepatic non-Hodgkin’s lymphoma infiltration. World J Hepatol 2010; 2(6): 246-250
- URL: https://www.wjgnet.com/1948-5182/full/v2/i6/246.htm
- DOI: https://dx.doi.org/10.4254/wjh.v2.i6.246


