Copyright
©The Author(s) 2022.
World J Hepatol. May 27, 2022; 14(5): 1025-1037
Published online May 27, 2022. doi: 10.4254/wjh.v14.i5.1025
Published online May 27, 2022. doi: 10.4254/wjh.v14.i5.1025
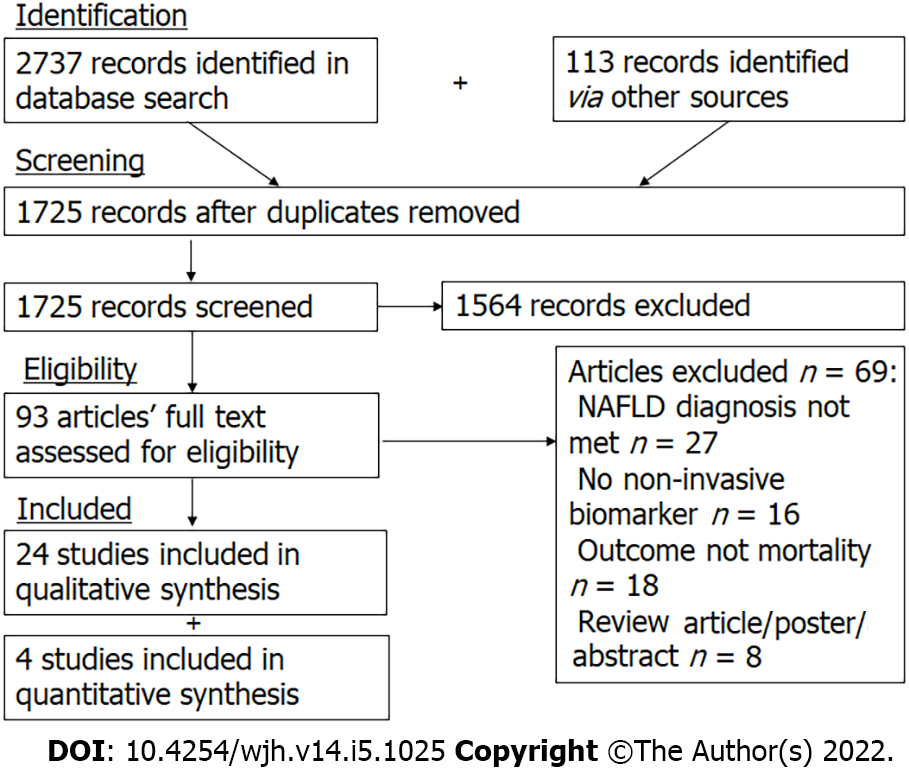
Figure 1 PRISMA flow diagram for study search.
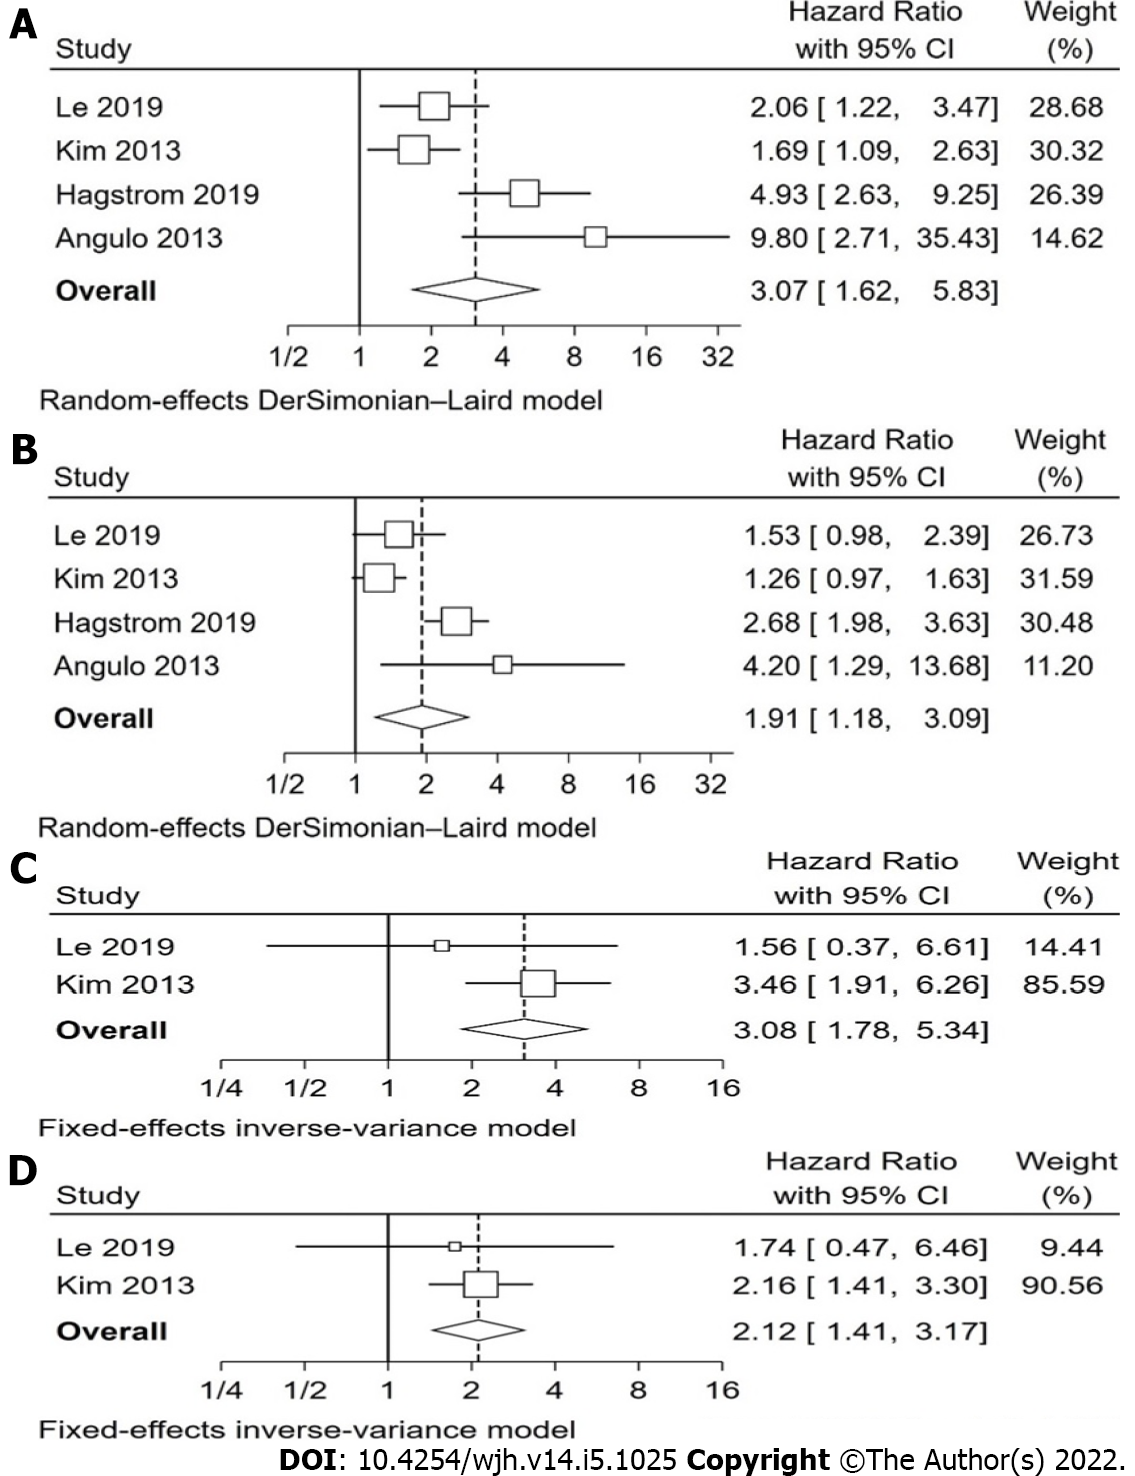
Figure 2 The forest plots for non-alcoholic fatty liver disease fibrosis score.
A: Non-alcoholic fatty liver disease (NAFLD) fibrosis score (NFS) high vs low and all-cause mortality; B: NFS intermediate vs low and all-cause mortality; C: NFS high vs low and cardiovascular mortality; D: NFS Intermediate vs Low and cardiovascular mortality.
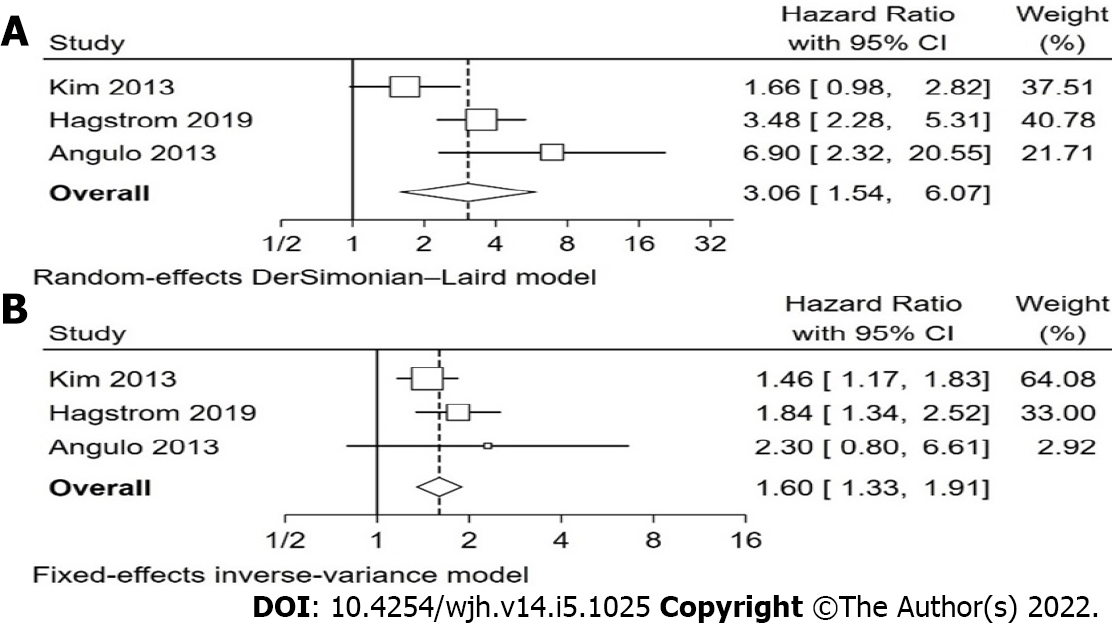
Figure 3 The forest plots for fibrosis-4 index.
A: Fibrosis-4 index (FIB-4) high vs low and all-cause mortality; B: FIB-4 intermediate vs low and all-cause mortality.
- Citation: Cianci N, Subhani M, Hill T, Khanna A, Zheng D, Sheth A, Crooks C, Aithal GP. Prognostic non-invasive biomarkers for all-cause mortality in non-alcoholic fatty liver disease: A systematic review and meta-analysis. World J Hepatol 2022; 14(5): 1025-1037
- URL: https://www.wjgnet.com/1948-5182/full/v14/i5/1025.htm
- DOI: https://dx.doi.org/10.4254/wjh.v14.i5.1025


