Copyright
©2013 Baishideng Publishing Group Co.
World J Stem Cells. Oct 26, 2013; 5(4): 229-237
Published online Oct 26, 2013. doi: 10.4252/wjsc.v5.i4.229
Published online Oct 26, 2013. doi: 10.4252/wjsc.v5.i4.229
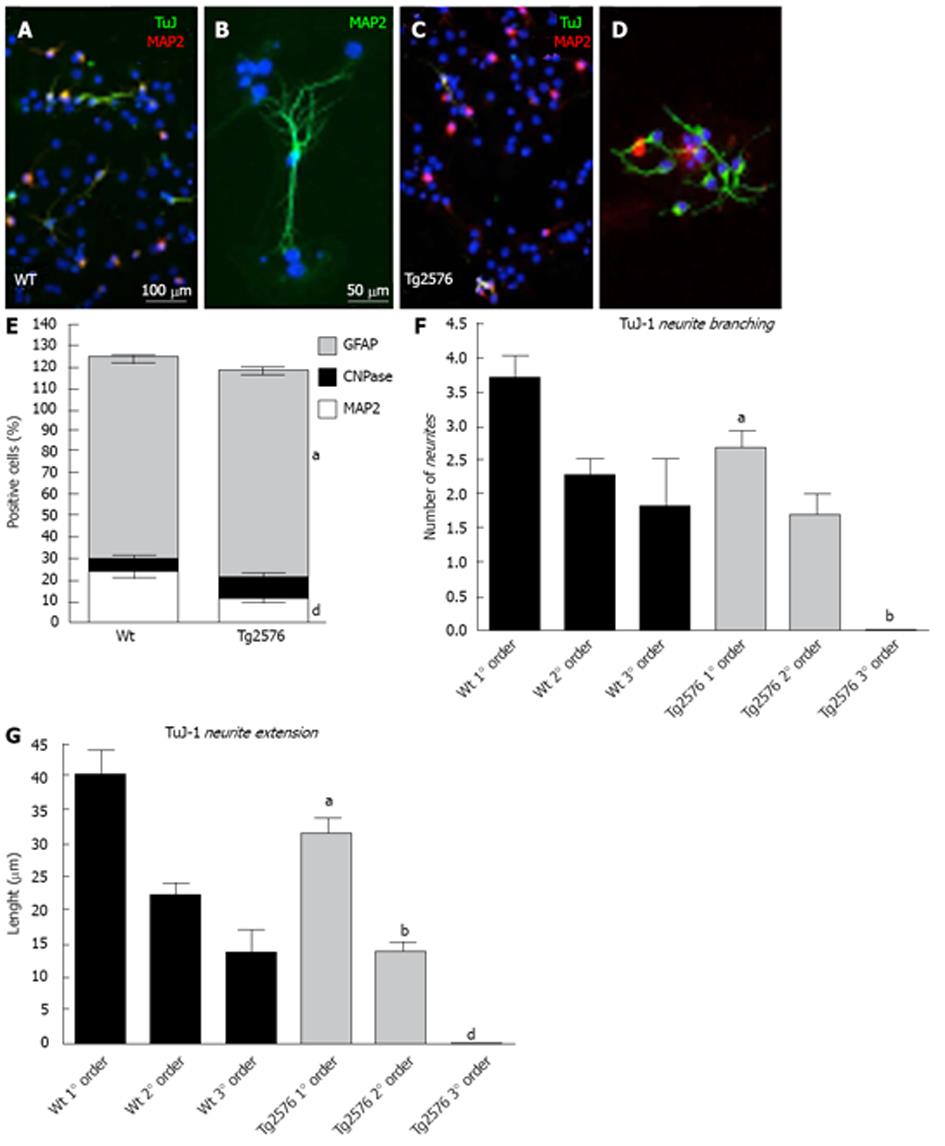
Figure 2 Morphological analysis.
A-D: Micrographs showing immunostaining for β-III-tubulin (TuJ-1) and MAP2 in Wt and Tg2576 cells. Hoechst 33258 nuclear staining was used to determine the total cell number; E: The analyses of cell lineage indicate an increase in GFAP- and a decrease in MAP2-positive cells in Tg2576 compared to Wt. The number of CNPase-positive cells does not vary between the two genotypes; F, G: neural maturation analysis shows both a decrease in TuJ-1 positive branching of the third order and in neurite extension in cells derived from Tg2576 animals. Statistical analysis: Student’s t-test. Graphs represent mean ± SE and asterisks represent significant differences between Tg2576 and Wt (aP < 0.05; bP < 0.01; dP < 0.001). Bars: A, C: 100 μm; B, D, 50 μm.
- Citation: Baldassarro VA, Lizzo G, Paradisi M, Fernández M, Giardino L, Calzà L. Neural stem cells isolated from amyloid precursor protein-mutated mice for drug discovery. World J Stem Cells 2013; 5(4): 229-237
- URL: https://www.wjgnet.com/1948-0210/full/v5/i4/229.htm
- DOI: https://dx.doi.org/10.4252/wjsc.v5.i4.229


