Copyright
©2013 Baishideng Publishing Group Co.
World J Stem Cells. Oct 26, 2013; 5(4): 205-216
Published online Oct 26, 2013. doi: 10.4252/wjsc.v5.i4.205
Published online Oct 26, 2013. doi: 10.4252/wjsc.v5.i4.205
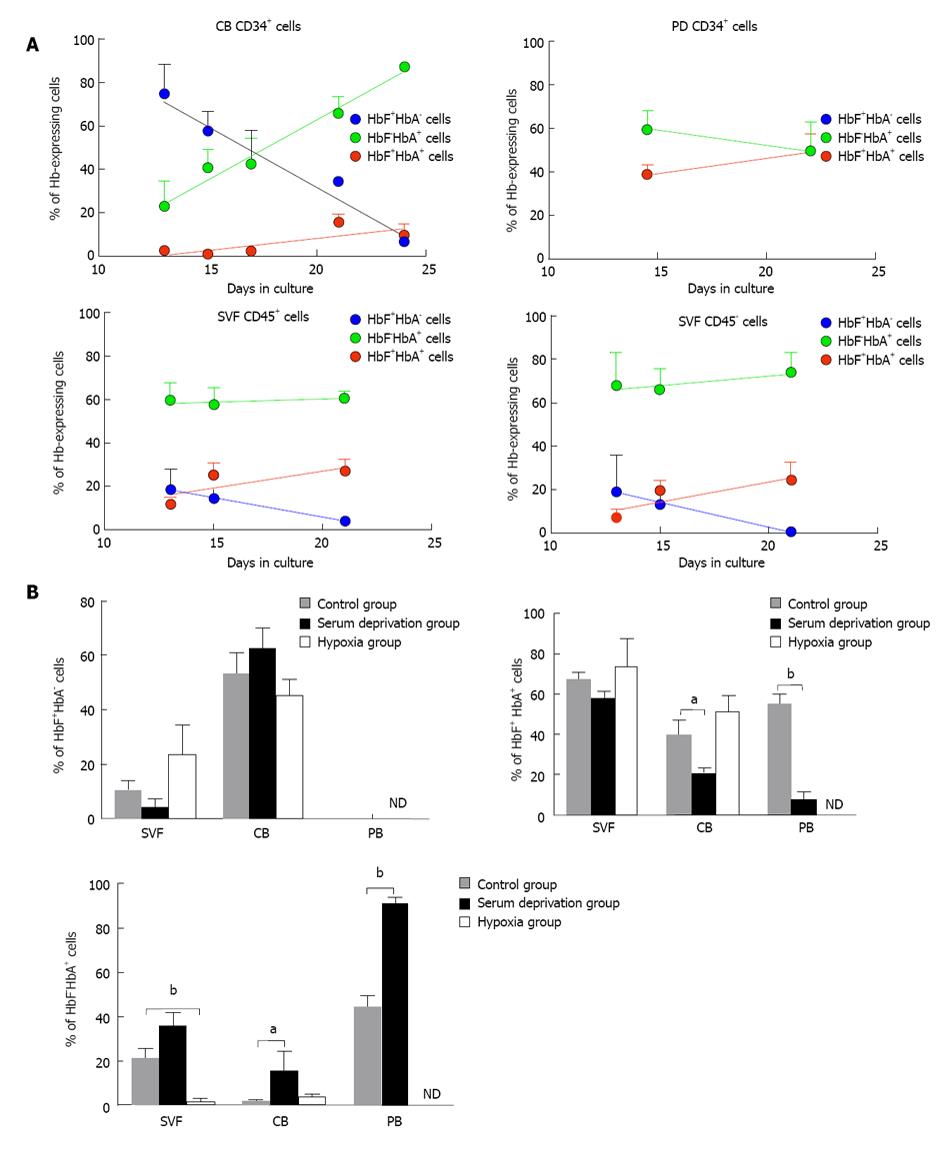
Figure 6 Effects of time and cell culture conditions on the pattern of hemoglobin expression in erythroid cells.
Individual burst-forming units-erythroid (BFU-E)-derived colonies generated in a methylcellulose-based medium were selected, pooled and analyzed for hemoglobin expression by flow cytometry. A: The kinetics of HbF+HbA- cells, HbF-HbA+ cells and HbF+HbA+ cells of erythroid cells in the different cultures over time are given. From top to bottom: erythroid cells derived from cord blood (CB) CD34+ cells, from peripheral blood (PB) CD34+ cells, from stromal vascular fraction (SVF) CD45+ cells and from SVF CD45- cells. The results are expressed as the percentage of total Hb-expressing cells (CB CD34+ cells, n = 7; PB CD34+ cells, n = 4; SVF CD45+ cells, n = 10 and SVF CD45+cells, n = 10). The data are provided as the means ± SE; B: A parallel series of cultures were performed to examine the effect of serum deprivation and hypoxia (5% O2) on hemoglobin expression. Control cultures were grown under conditions of normoxia (20% O2) using a serum-containing medium. SVF cells, n = 10; CB CD34+ cells, n = 10; PB CD34+ cells, n = 4. BFU-E-derived erythroid cells were analyzed by flow cytometry for hemoglobin composition at day 15 of culture. The results are expressed as the percentage of total Hb-expressing cells. The data are provided as the mean ± SE. aP < 0.02, aP < 0.0001. ND: Not detected. CB: Cord blood; PB: Peripheral blood; SVF: Stromal vascular fraction.
- Citation: Navarro A, Carbonell-Uberos F, Marín S, Miñana MD. Human adipose tissue contains erythroid progenitors expressing fetal hemoglobin. World J Stem Cells 2013; 5(4): 205-216
- URL: https://www.wjgnet.com/1948-0210/full/v5/i4/205.htm
- DOI: https://dx.doi.org/10.4252/wjsc.v5.i4.205


