Copyright
©2013 Baishideng Publishing Group Co.
World J Stem Cells. Oct 26, 2013; 5(4): 205-216
Published online Oct 26, 2013. doi: 10.4252/wjsc.v5.i4.205
Published online Oct 26, 2013. doi: 10.4252/wjsc.v5.i4.205
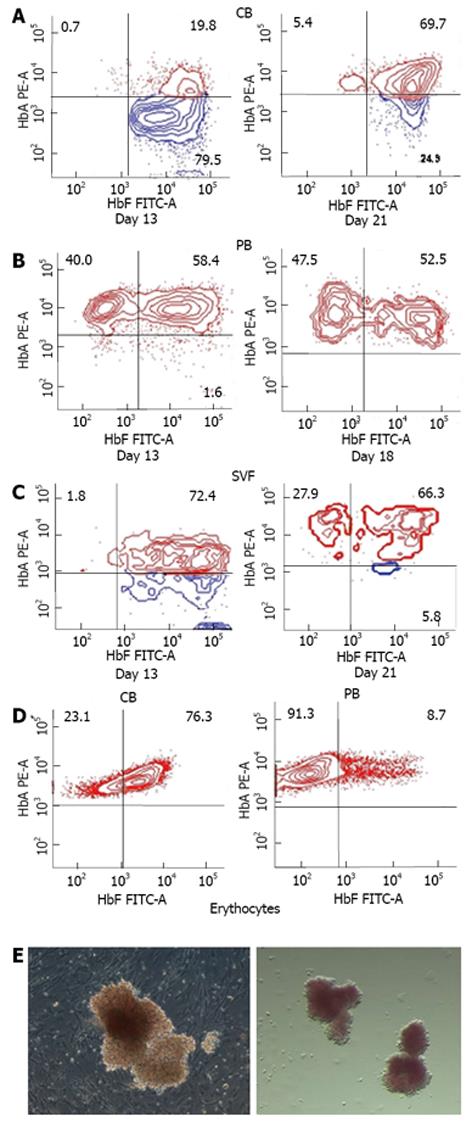
Figure 3 Representative flow cytometric dot plots of hemoglobin expression in erythroid cells.
Burst-forming units-erythroid (BFU-E)-derived colonies were analyzed for HbF and HbA expression by flow cytometry after different lengths of time in culture. Erythroid cells generated from cord blood (CB) CD34+ cells (A), from peripheral blood (PB) CD34+ cells (B), and from stromal vascular fraction (SVF) cells (C). Representative fluorescence-activated cell sorting plots showing hemoglobin expression in circulating erythrocytes from CB and PB (D). Representative phase-contrast photomicrographs showing the morphological aspect of the BFU-Es generated from CD45- (left) and CD45+(right) cells isolated from SVF (E). HbF: Fetal hemoglobin; HbA: Adult hemoglobin; CB: Cord blood; PB: Peripheral blood.
- Citation: Navarro A, Carbonell-Uberos F, Marín S, Miñana MD. Human adipose tissue contains erythroid progenitors expressing fetal hemoglobin. World J Stem Cells 2013; 5(4): 205-216
- URL: https://www.wjgnet.com/1948-0210/full/v5/i4/205.htm
- DOI: https://dx.doi.org/10.4252/wjsc.v5.i4.205


