Copyright
©2011 Baishideng Publishing Group Co.
World J Stem Cells. Apr 26, 2011; 3(4): 34-42
Published online Apr 26, 2011. doi: 10.4252/wjsc.v3.i4.34
Published online Apr 26, 2011. doi: 10.4252/wjsc.v3.i4.34
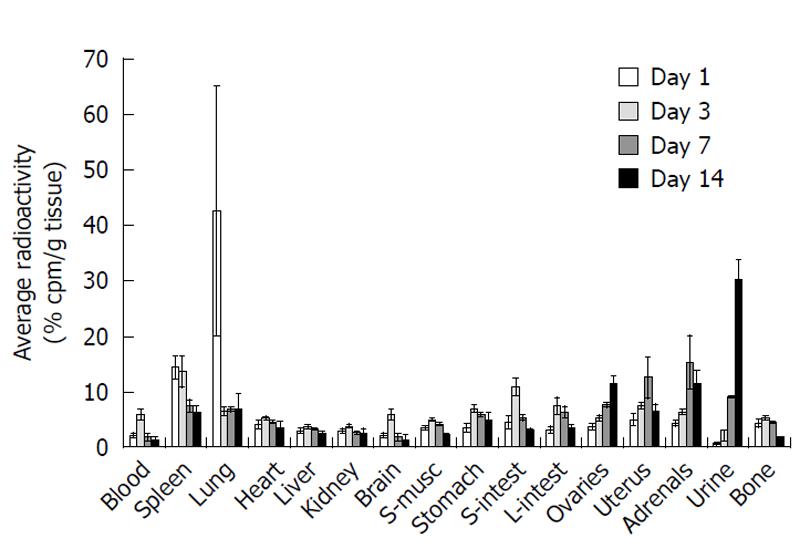
Figure 2 Average tissue distribution of radiolabeled human umbilical cord matrix stem cells 1 d (white bars), 3 d (light grey bars), 7 d (dark grey bars) and 14 d (black bars) after the cell injection.
Mice were injected through a lateral tail vein with 5 × 10⁵ human umbilical cord matrix stem cells labeled with tritiated thymidine and sacrificed 1, 3, 7, and 14 d after the injection. All tissues were individually dissected and homogenized with 9-20 volumes of 1 × PBS. Radioactivity was measured in duplicate determinations as described in the Methods. All presented data are normalized by subtracting non-specific radioactivity from respective control tissues and presented as mean ± SE. Data are expressed as% average activity per gram tissue.
- Citation: Maurya DK, Doi C, Pyle M, Rachakatla RS, Davis D, Tamura M, Troyer D. Non-random tissue distribution of human naïve umbilical cord matrix stem cells. World J Stem Cells 2011; 3(4): 34-42
- URL: https://www.wjgnet.com/1948-0210/full/v3/i4/34.htm
- DOI: https://dx.doi.org/10.4252/wjsc.v3.i4.34


