Copyright
©2010 Baishideng Publishing Group Co.
World J Stem Cells. Dec 26, 2010; 2(6): 127-140
Published online Dec 26, 2010. doi: 10.4252/wjsc.v2.i6.127
Published online Dec 26, 2010. doi: 10.4252/wjsc.v2.i6.127
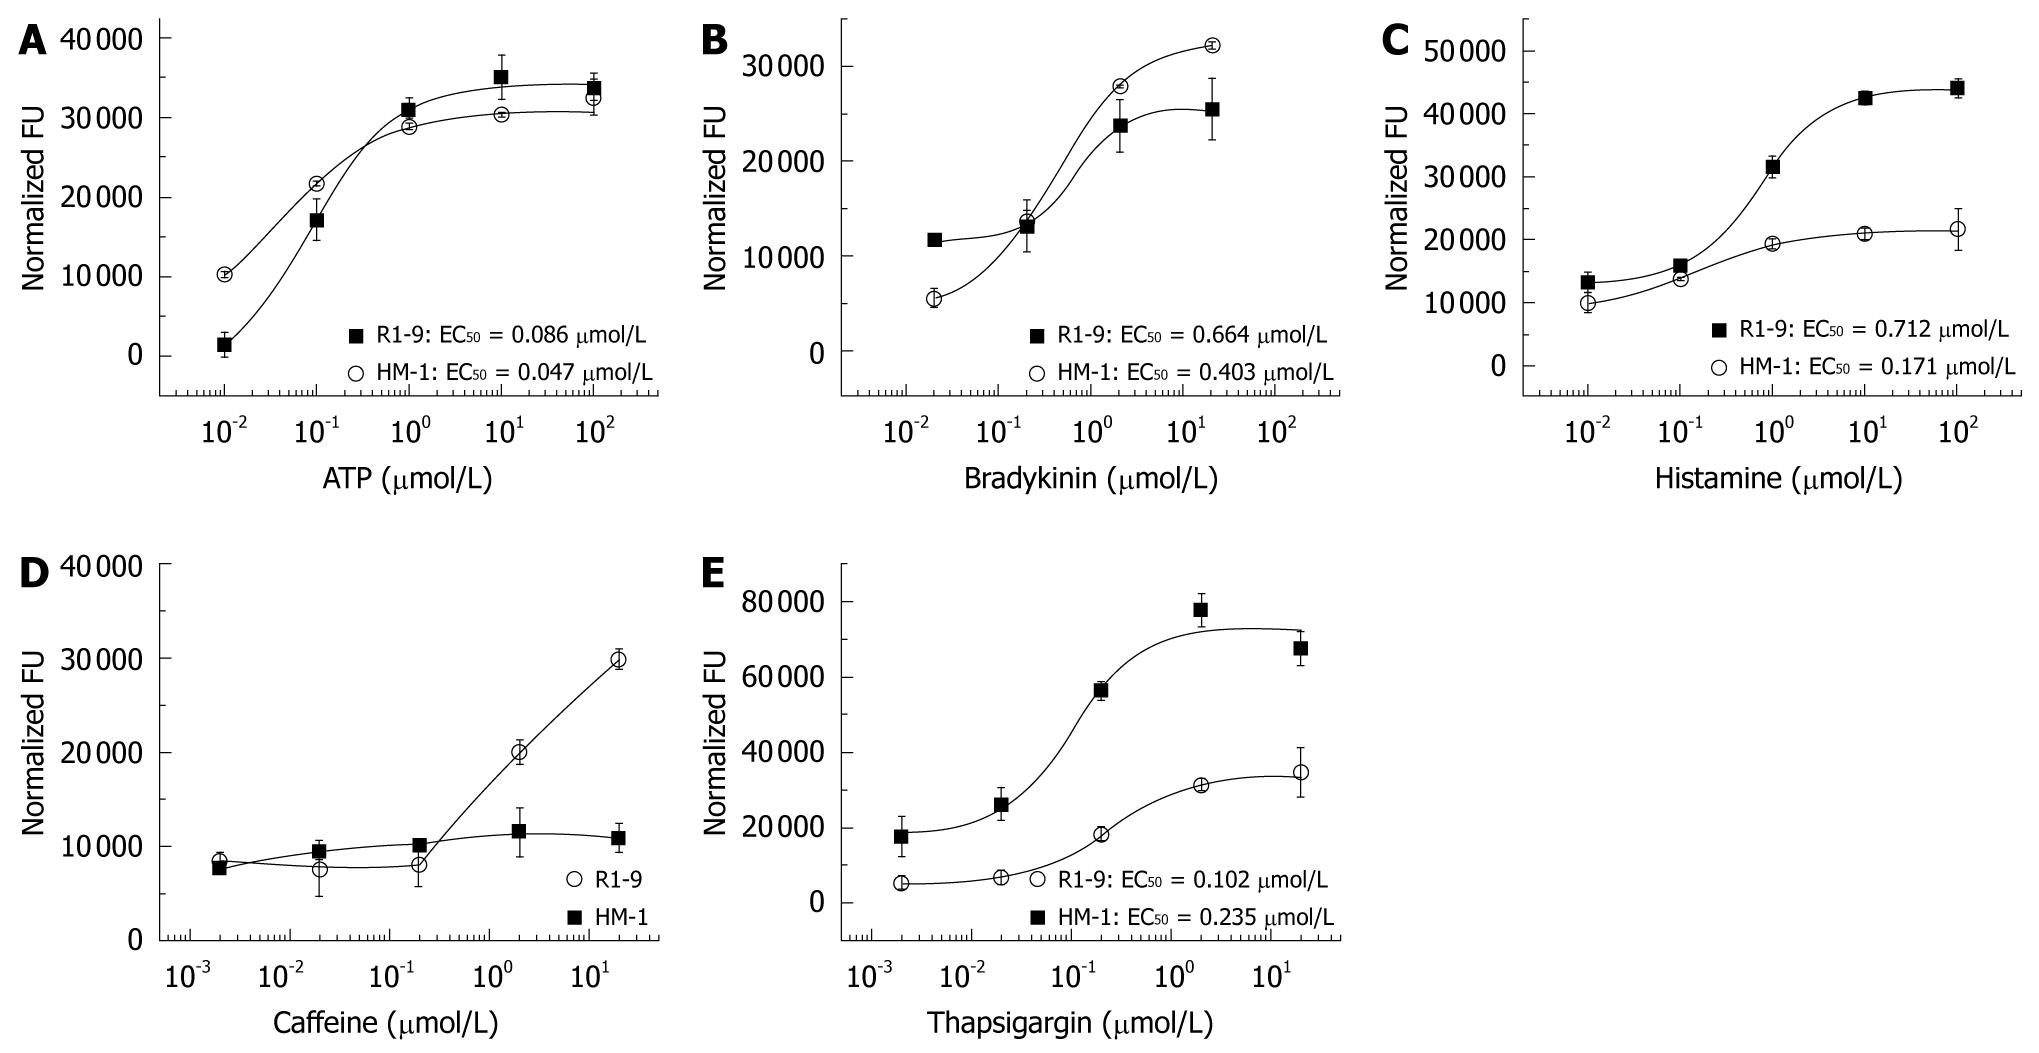
Figure 3 Comparison of agonist-induced changes in [Ca2+]i in mouse R1 and HM-1 embryonic stem cells.
The plates were placed into a FlexStation II384 (FLIPR) to monitor cell fluorescence (lEX = 494 nmol/L, lEM = 516 nmol/L, FU, fluorescence units) before and after the addition of various concentrations of agents in high-Ca (1.8 mmol/L) Hank’s medium. A: ATP; B: Bradykinin; C: Histamine; D: Caffeine; E: Thapsigargin.
- Citation: Mamo S, Kobolak J, Borbíró I, Bíró T, Bock I, Dinnyes A. Gene targeting and Calcium handling efficiencies in mouse embryonic stem cell lines. World J Stem Cells 2010; 2(6): 127-140
- URL: https://www.wjgnet.com/1948-0210/full/v2/i6/127.htm
- DOI: https://dx.doi.org/10.4252/wjsc.v2.i6.127


