
















Copyright: ©Author(s) 2026.
World J Stem Cells. Sep 26, 2026; 18(9): 124540
Published online Sep 26, 2026. doi: 10.4252/wjsc.124540
Published online Sep 26, 2026. doi: 10.4252/wjsc.124540
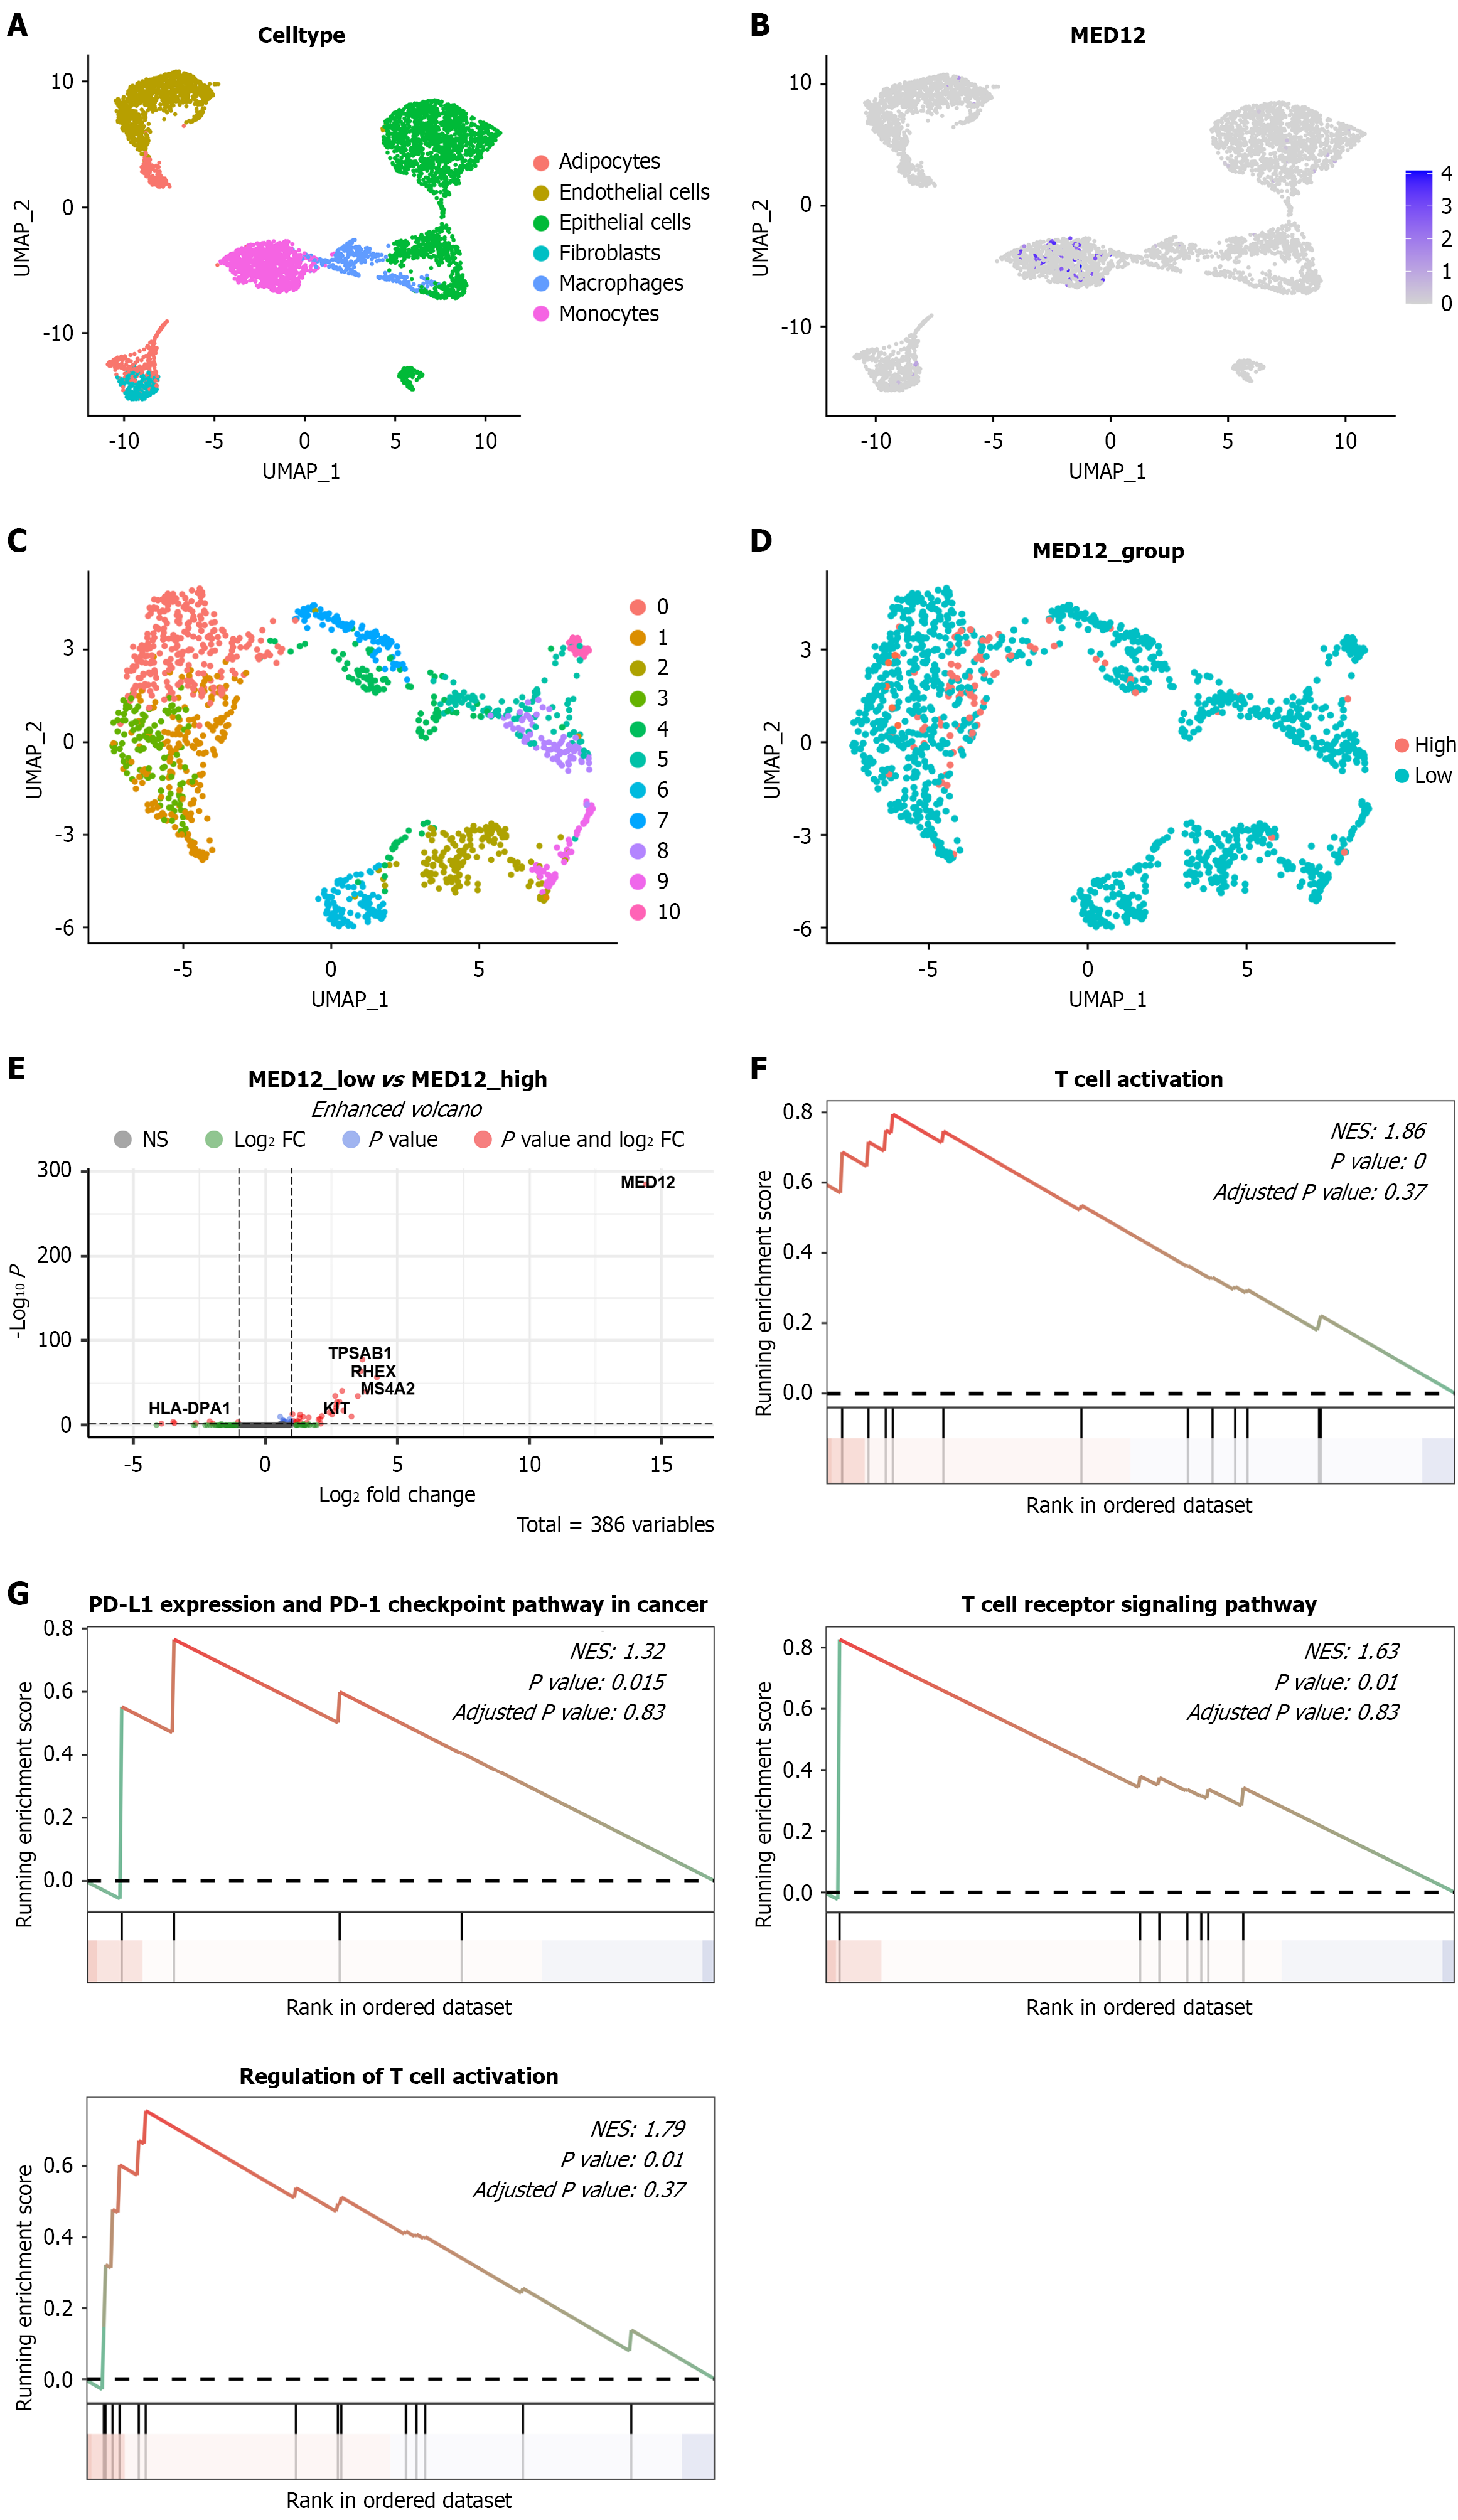
Figure 5 Elucidation of the association between mediator complex subunit 12 expression and immune cell infiltration based on single-cell sequencing data.
A: UMAP plot showing the identification of 6 cell subpopulations based on canonical cell markers; B: UMAP plot showing the distribution of mediator complex subunit 12 (MED12) expression across cell subpopulations; C: UMAP plot showing the sub clustering of macrophages and monocytes; D: UMAP plot showing the distribution of MED12-high and MED12-low expression groups within macrophage and monocyte subpopulations; E: Volcano plot showing differentially expressed genes between MED12-high and MED12-low cells; F: Gene set enrichment analysis (GSEA) enrichment analysis of differentially expressed genes based on the Gene Ontology database; G: GSEA enrichment analysis of differentially expressed genes based on the Kyoto Encyclopedia of Genes and Genomes database. MED12: Mediator complex subunit 12; PD-L1: Programmed death ligand-1.
- Citation: Yang Y, Zhong JL, Liu JY. MED12 mutation activates Notch signaling to enhance cancer stemness and suppress CD8+ T cell cytotoxicity in lung cancer. World J Stem Cells 2026; 18(9): 124540
- URL: https://www.wjgnet.com/1948-0210/full/v18/i9/124540.htm
- DOI: https://dx.doi.org/10.4252/wjsc.124540