
















Copyright: ©Author(s) 2026.
World J Stem Cells. Aug 26, 2026; 18(8): 120831
Published online Aug 26, 2026. doi: 10.4252/wjsc.120831
Published online Aug 26, 2026. doi: 10.4252/wjsc.120831
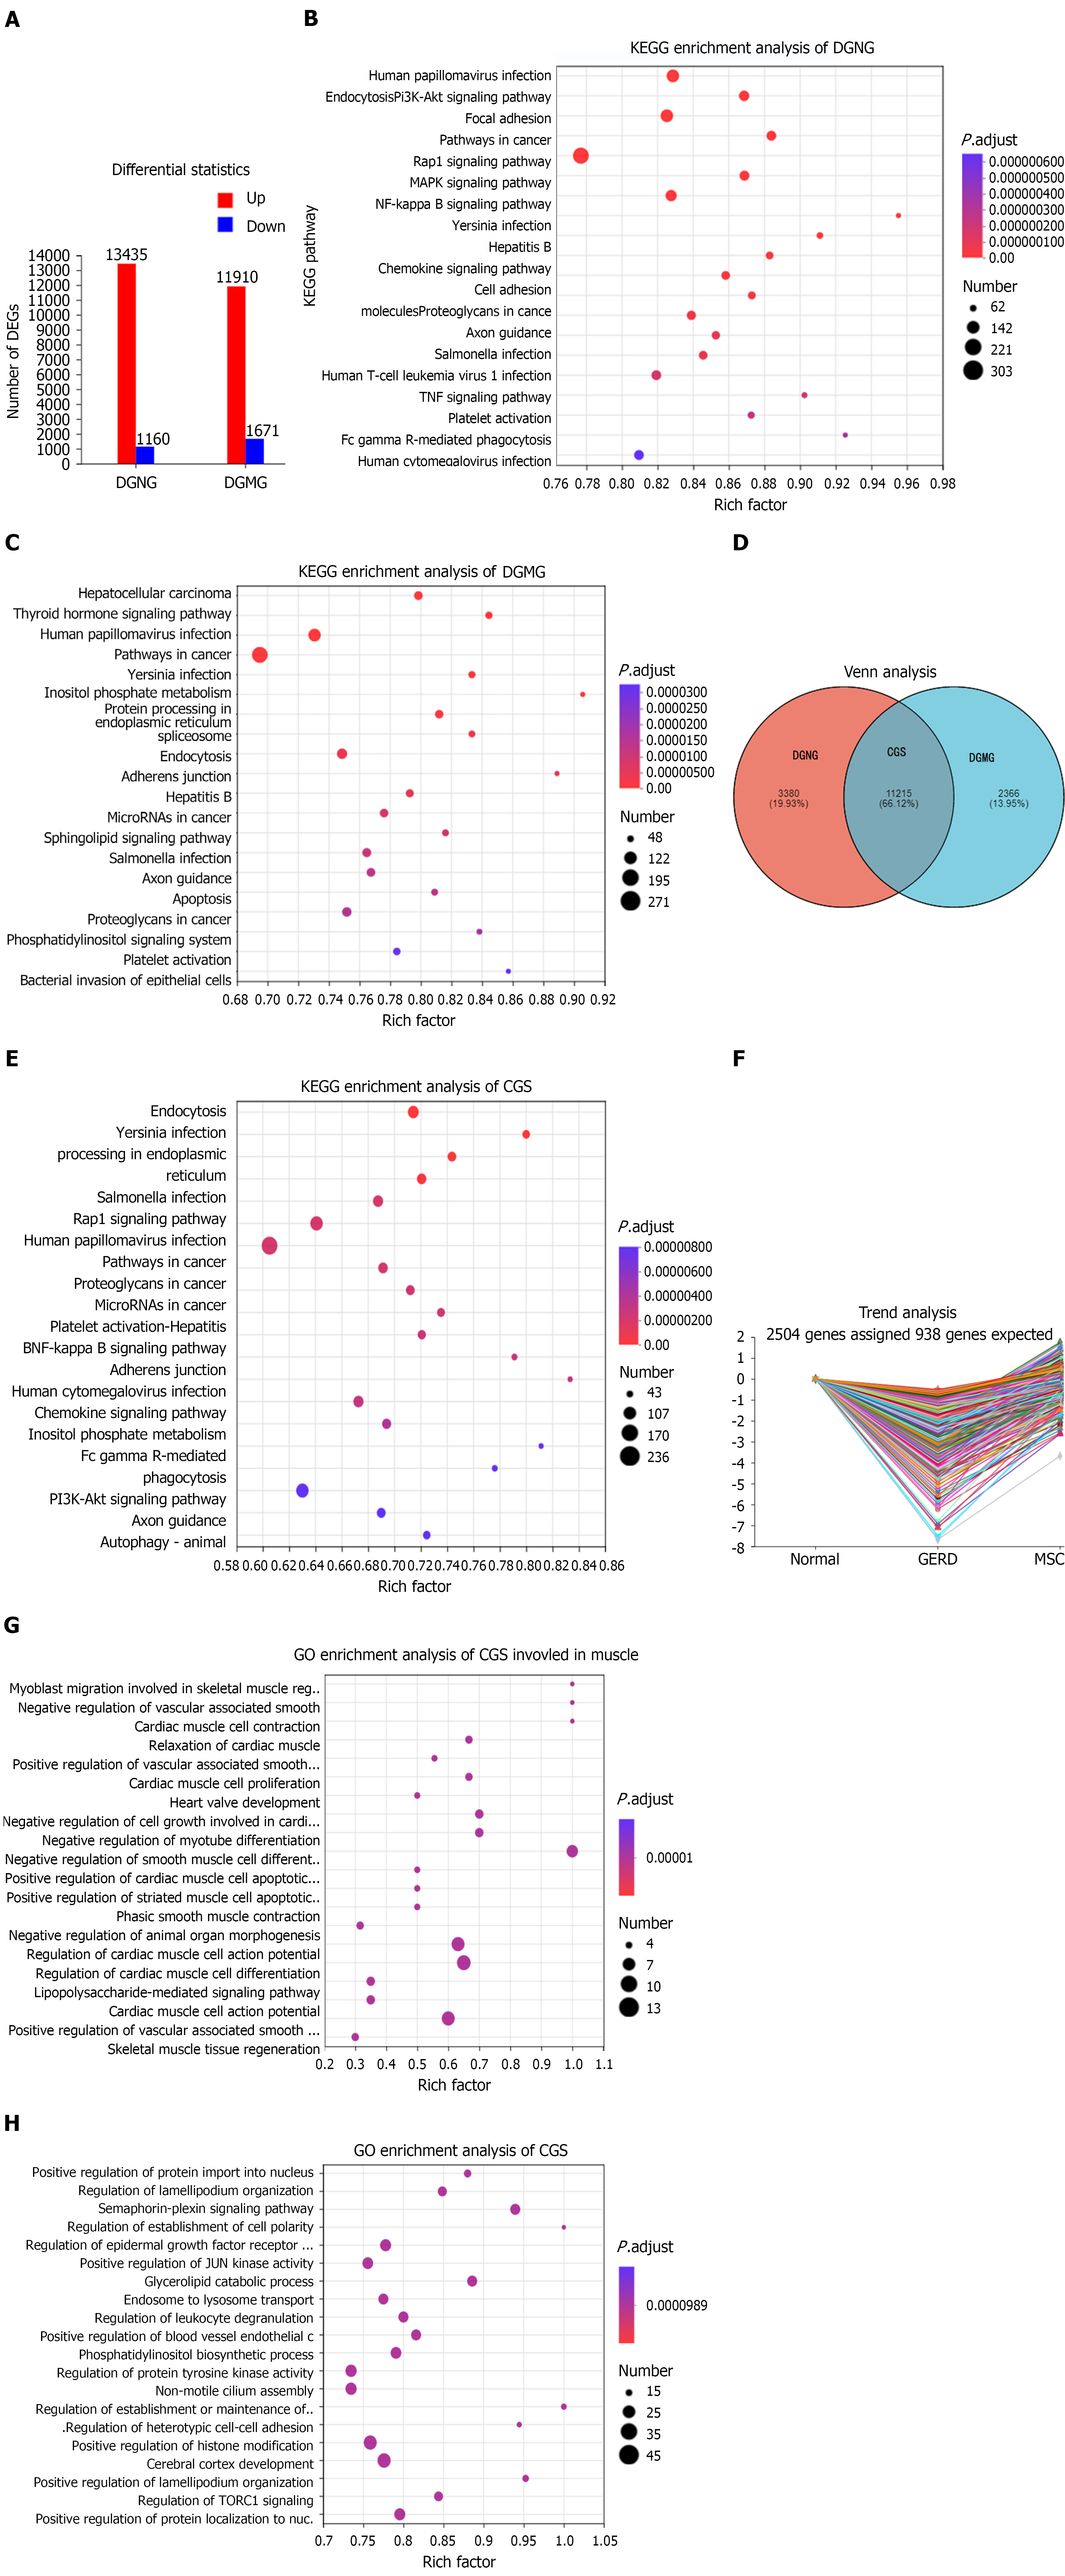
Figure 7 Transcriptomic analysis reveals mesenchymal stem cell-mediated pathway modulation.
This figure presents a series of bioinformatics analyses comparing gene expression. A: Bar chart illustrating the number of significantly differentially expressed genes; B: Kyoto Encyclopedia of Genes and Genomes (KEGG) pathway enrichment analysis of genes differentially expressed between the gastroesophageal reflux disease and normal groups (DGNG); C: KEGG pathway enrichment analysis of genes differentially expressed between the gastroesophageal reflux disease and mesenchymal stem cell groups (DGMG); D: Venn diagram illustrating the overlap between differentially expressed genes in DGNG and DGMG; E: KEGG pathway enrichment analysis of common genes; F: Trend analysis of common genes; G: Gene Ontology (GO) enrichment analysis specifically focusing on muscle-related clusters within common genes; H: GO enrichment analysis of common genes. The bubble plot shows enriched pathways, with bubble size indicating the number of genes and color representing the adjusted P-value in KEGG and GO enrichment analysis. DEGs: Differentially expressed genes; KEGG: Kyoto Encyclopedia of Genes and Genomes; CGS: Common genes; GERD: Gastroesophageal reflux disease; MSC: Mesenchymal stem cell; GO: Gene Ontology.
- Citation: Li Y, Zhu WY, Zhang B, Wang ZR, Chen ZY, Chen QQ, Linghu EQ. Mesenchymal stem cells therapy ameliorates esophageal dysmotility in gastroesophageal reflux disease by modulating smooth muscle contractility, alleviating senescence by targeting the DNMT3a-HIF1α axis. World J Stem Cells 2026; 18(8): 120831
- URL: https://www.wjgnet.com/1948-0210/full/v18/i8/120831.htm
- DOI: https://dx.doi.org/10.4252/wjsc.120831