
















Copyright: ©Author(s) 2026.
World J Stem Cells. Aug 26, 2026; 18(8): 117617
Published online Aug 26, 2026. doi: 10.4252/wjsc.117617
Published online Aug 26, 2026. doi: 10.4252/wjsc.117617
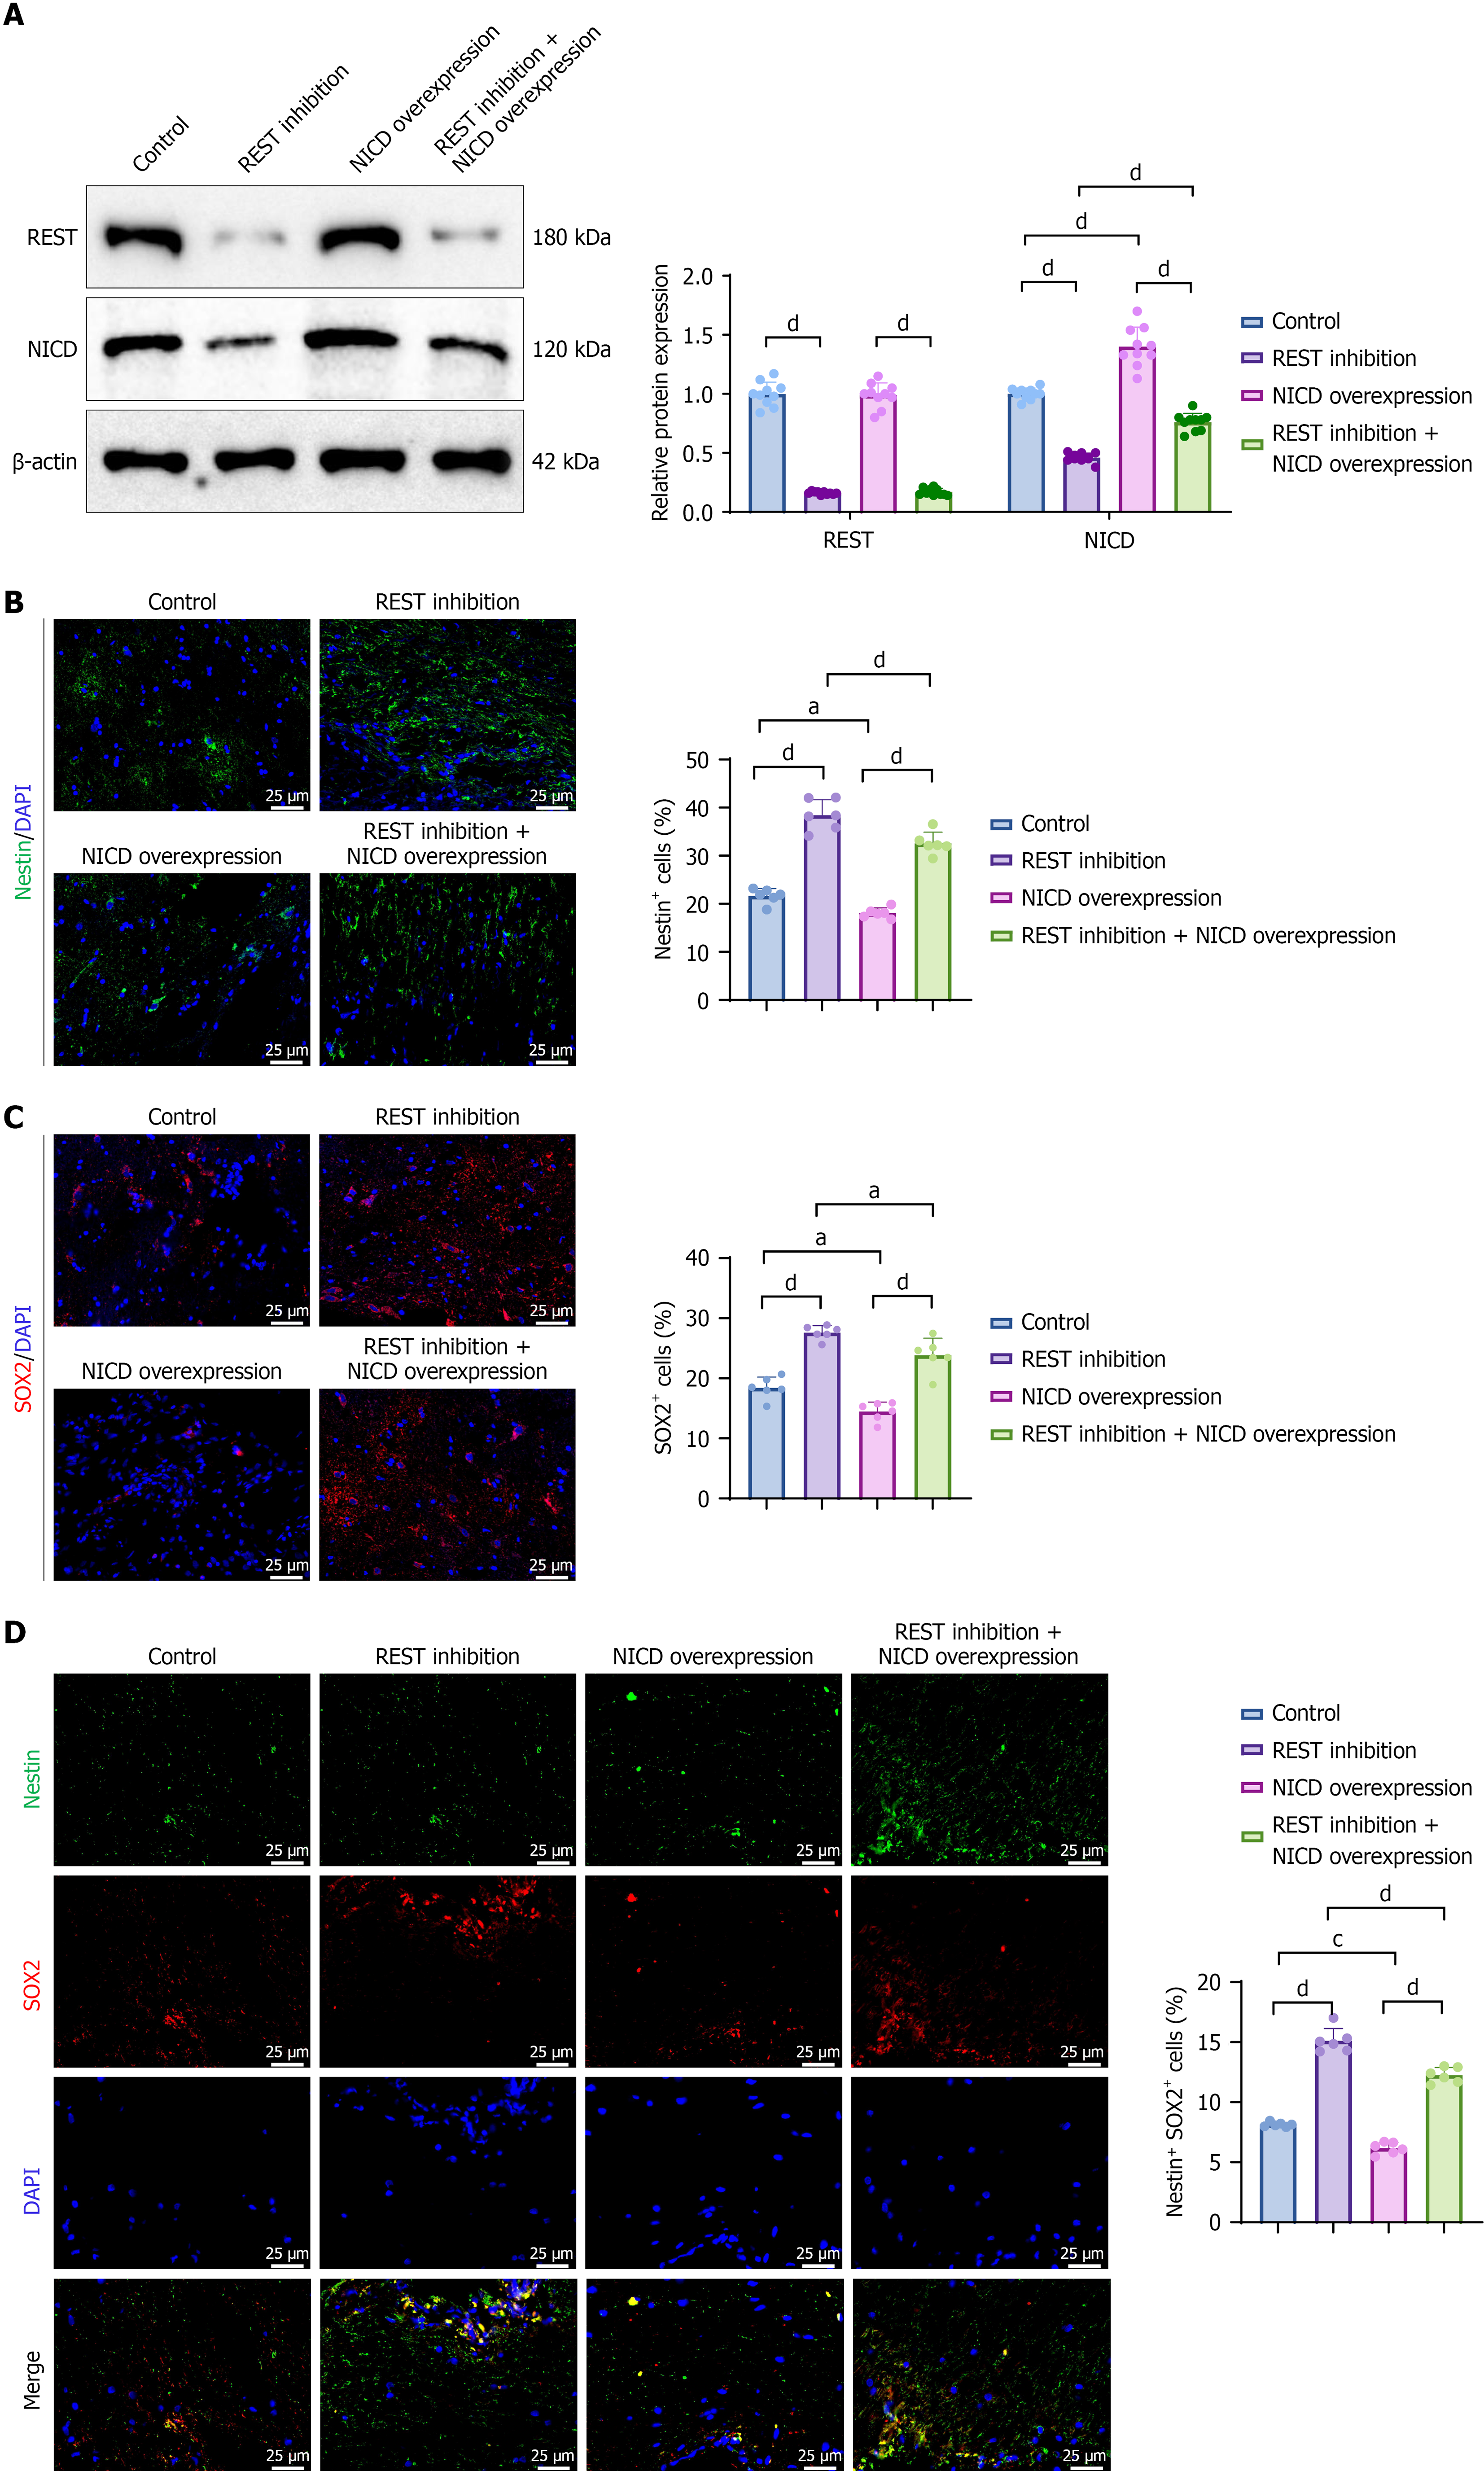
Figure 9 RE1-silencing transcription factor inhibition promotes the re-expression of neural stem cell markers in the lesion area.
A: Western blot analysis of RE1-silencing transcription factor (REST) and NICD protein expression in each group, with β-actin used as the internal control; B: Immunofluorescence images showing the distribution of Nestin (green) and DAPI (blue) signals in the control and REST inhibition groups. Scale bar = 25 μm. The bar graph on the right shows the quantitative comparison of the proportion of Nestin+ cells (n = 6, three fields per group); C: Immunofluorescence images displaying SOX2 (red) and DAPI (blue) signals in the control and REST inhibition groups. Scale bar = 25 μm. The bar graph on the right shows the quantitative comparison of the proportion of SOX2+ cells (n = 6, three fields per group); D: Co-localization images of Nestin (green) and SOX2 (red) double-positive cells. Scale bar = 25 μm. The bar graph below shows the quantitative comparison of the proportion of Nestin (green) and SOX2 (red) double-positive cells (n = 6, three fields per group). Statistical analysis was performed using one-way analysis of variance (ANOVA) followed by Tukey’s post hoc test, with significance set at P < 0.05. aP < 0.05, cP < 0.001, dP < 0.0001. REST: RE1-silencing transcription factor.
- Citation: Xie ZC, Zhao XY, Xiong RH, Zhang XL, Yang W. Dynamic regulation of neural stem cell state transitions by NOTCH1-REST transcriptional axis. World J Stem Cells 2026; 18(8): 117617
- URL: https://www.wjgnet.com/1948-0210/full/v18/i8/117617.htm
- DOI: https://dx.doi.org/10.4252/wjsc.117617