
















Copyright: ©Author(s) 2026.
World J Stem Cells. Aug 26, 2026; 18(8): 117617
Published online Aug 26, 2026. doi: 10.4252/wjsc.117617
Published online Aug 26, 2026. doi: 10.4252/wjsc.117617
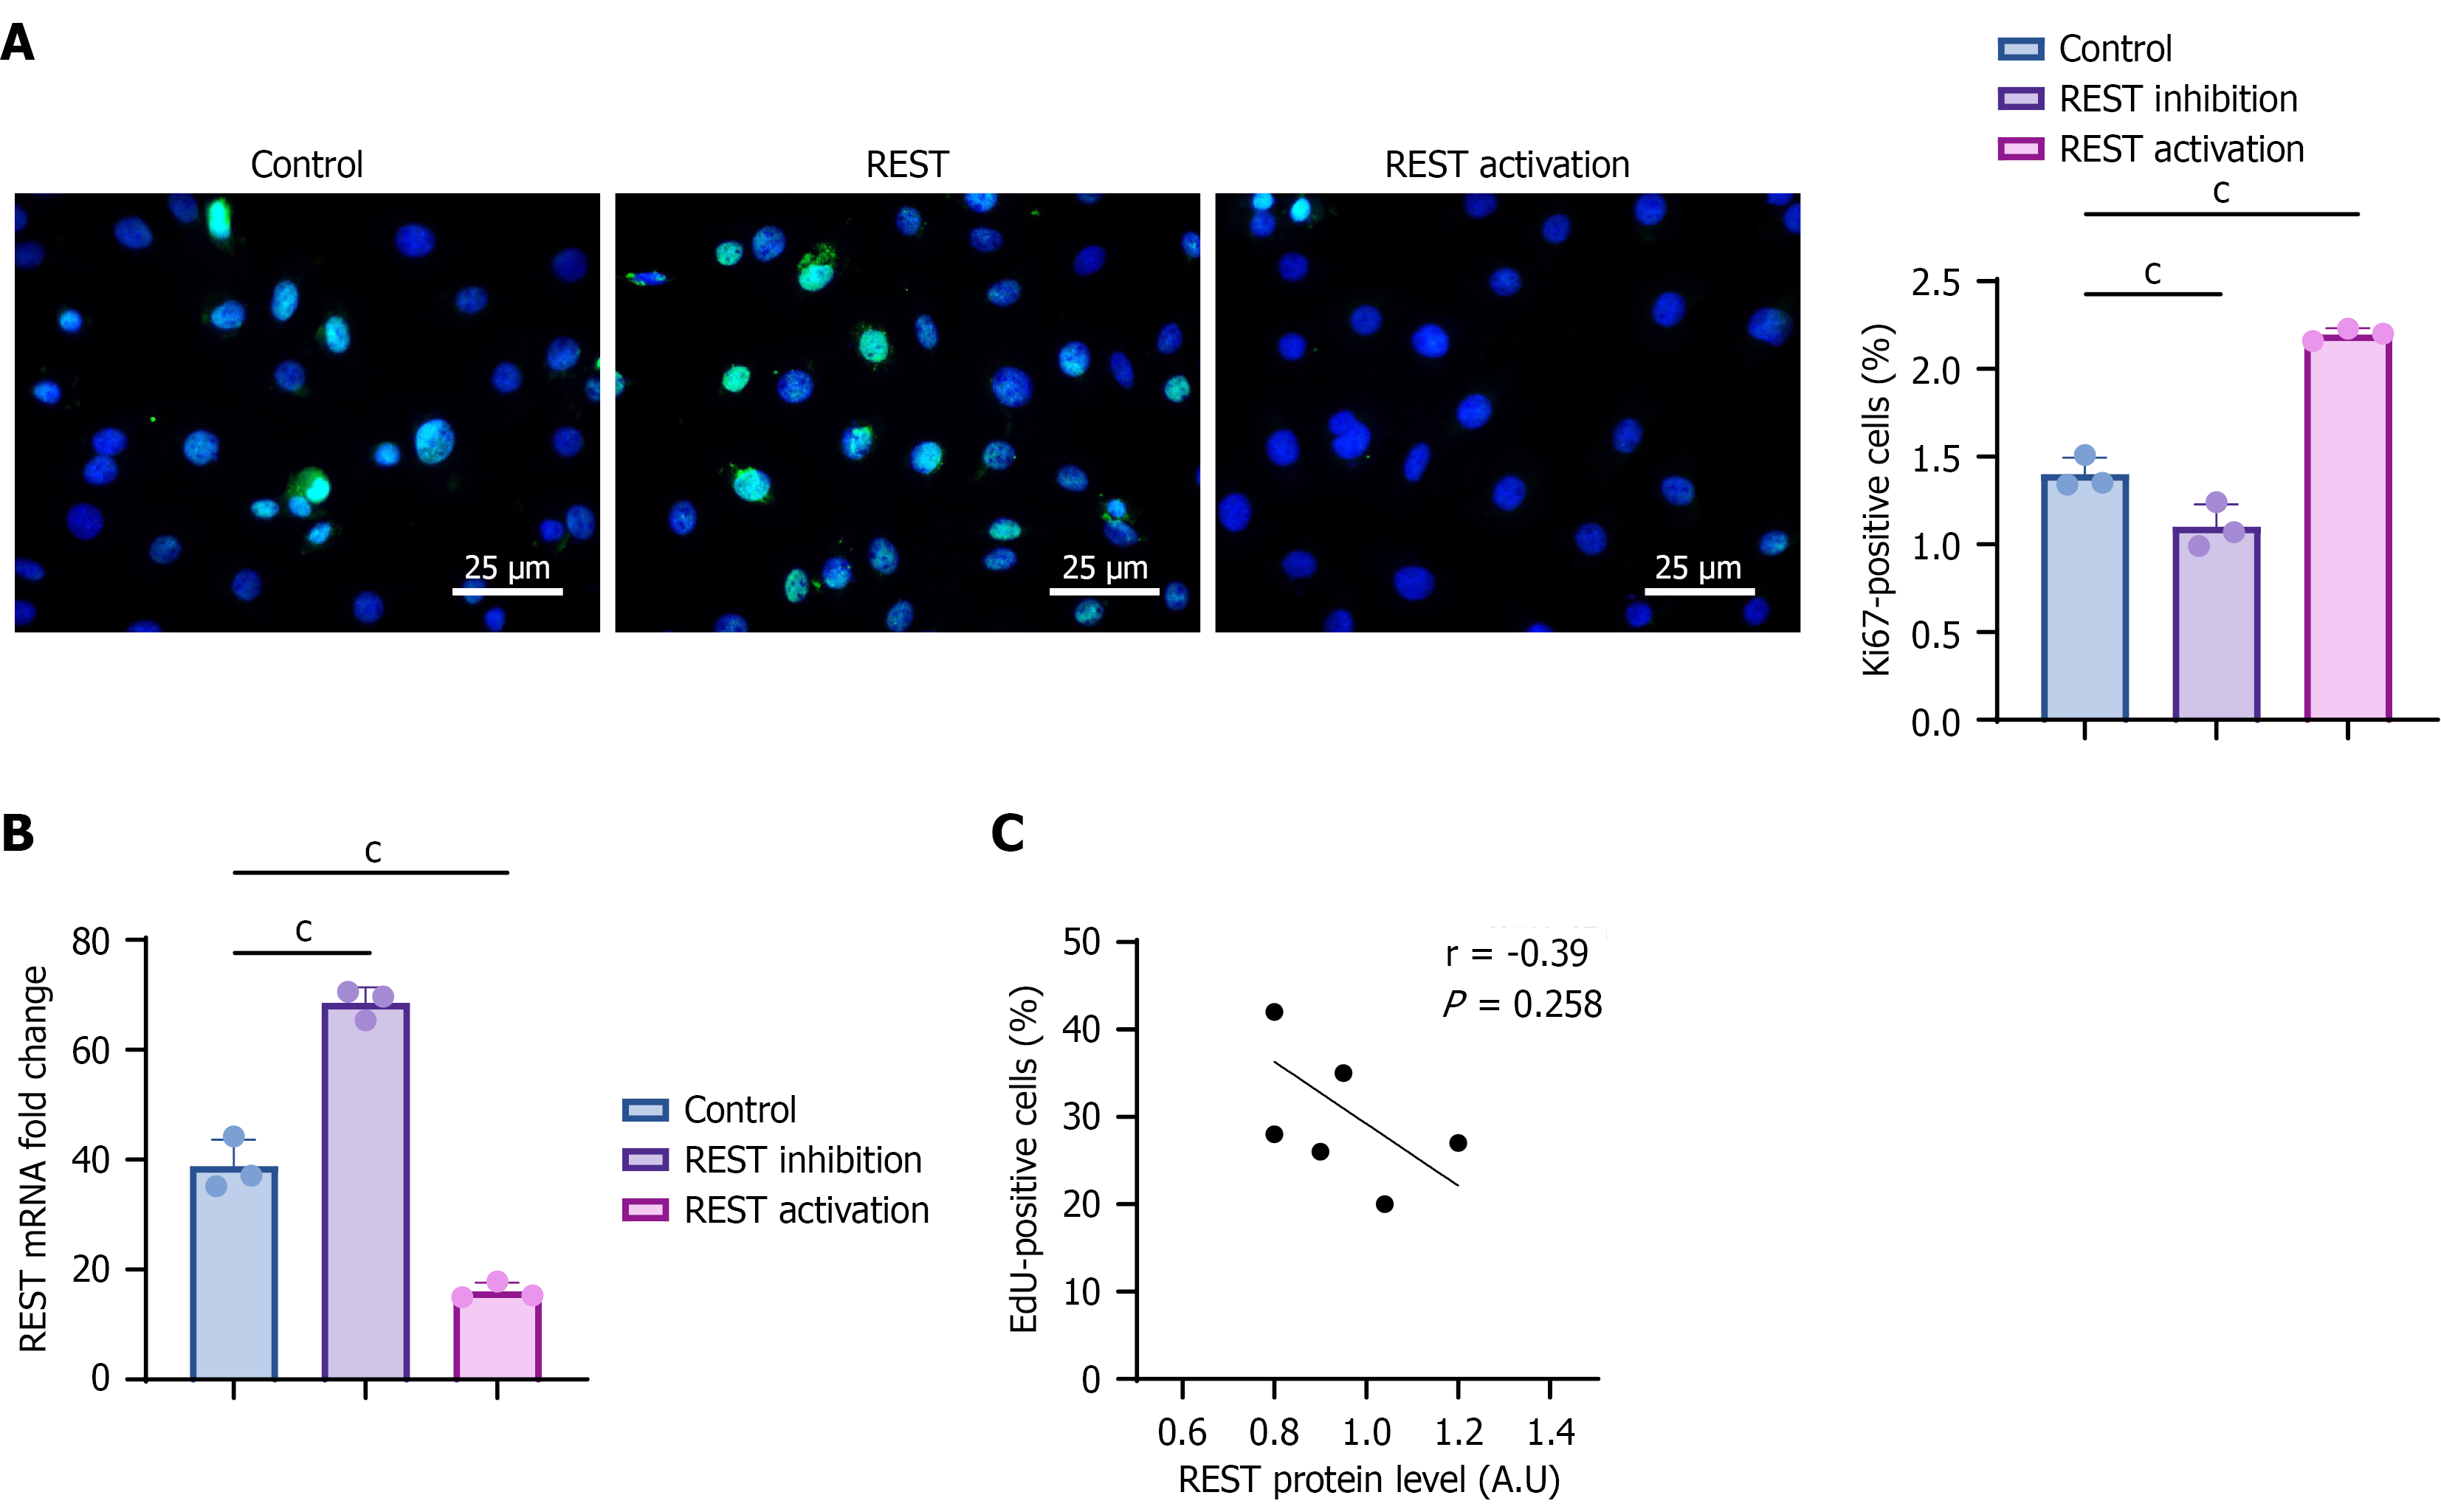
Figure 8 The organoid model reveals time-dependent regulation of cell states by the Notch-RE1-silencing transcription factor axis in a three-dimensional microenvironment.
A: Immunofluorescence images and quantitative analysis of Ki67+ cell proportions following RE1-silencing transcription factor (REST) inhibition and activation treatments. Ki67 is shown in green, DAPI in blue. Scale bar = 50 μm; B: Effects of REST inhibition and REST activation on REST mRNA expression levels (n = 3); C: Correlation analysis between REST expression and Ki67+ cell proportions at different time points under Jagged1 treatment, showing a non-significant negative trend (r = -0.39, P = 0.258). cP < 0.001. REST: RE1-silencing transcription factor.
- Citation: Xie ZC, Zhao XY, Xiong RH, Zhang XL, Yang W. Dynamic regulation of neural stem cell state transitions by NOTCH1-REST transcriptional axis. World J Stem Cells 2026; 18(8): 117617
- URL: https://www.wjgnet.com/1948-0210/full/v18/i8/117617.htm
- DOI: https://dx.doi.org/10.4252/wjsc.117617