
















Copyright: ©Author(s) 2026.
World J Stem Cells. Aug 26, 2026; 18(8): 117617
Published online Aug 26, 2026. doi: 10.4252/wjsc.117617
Published online Aug 26, 2026. doi: 10.4252/wjsc.117617
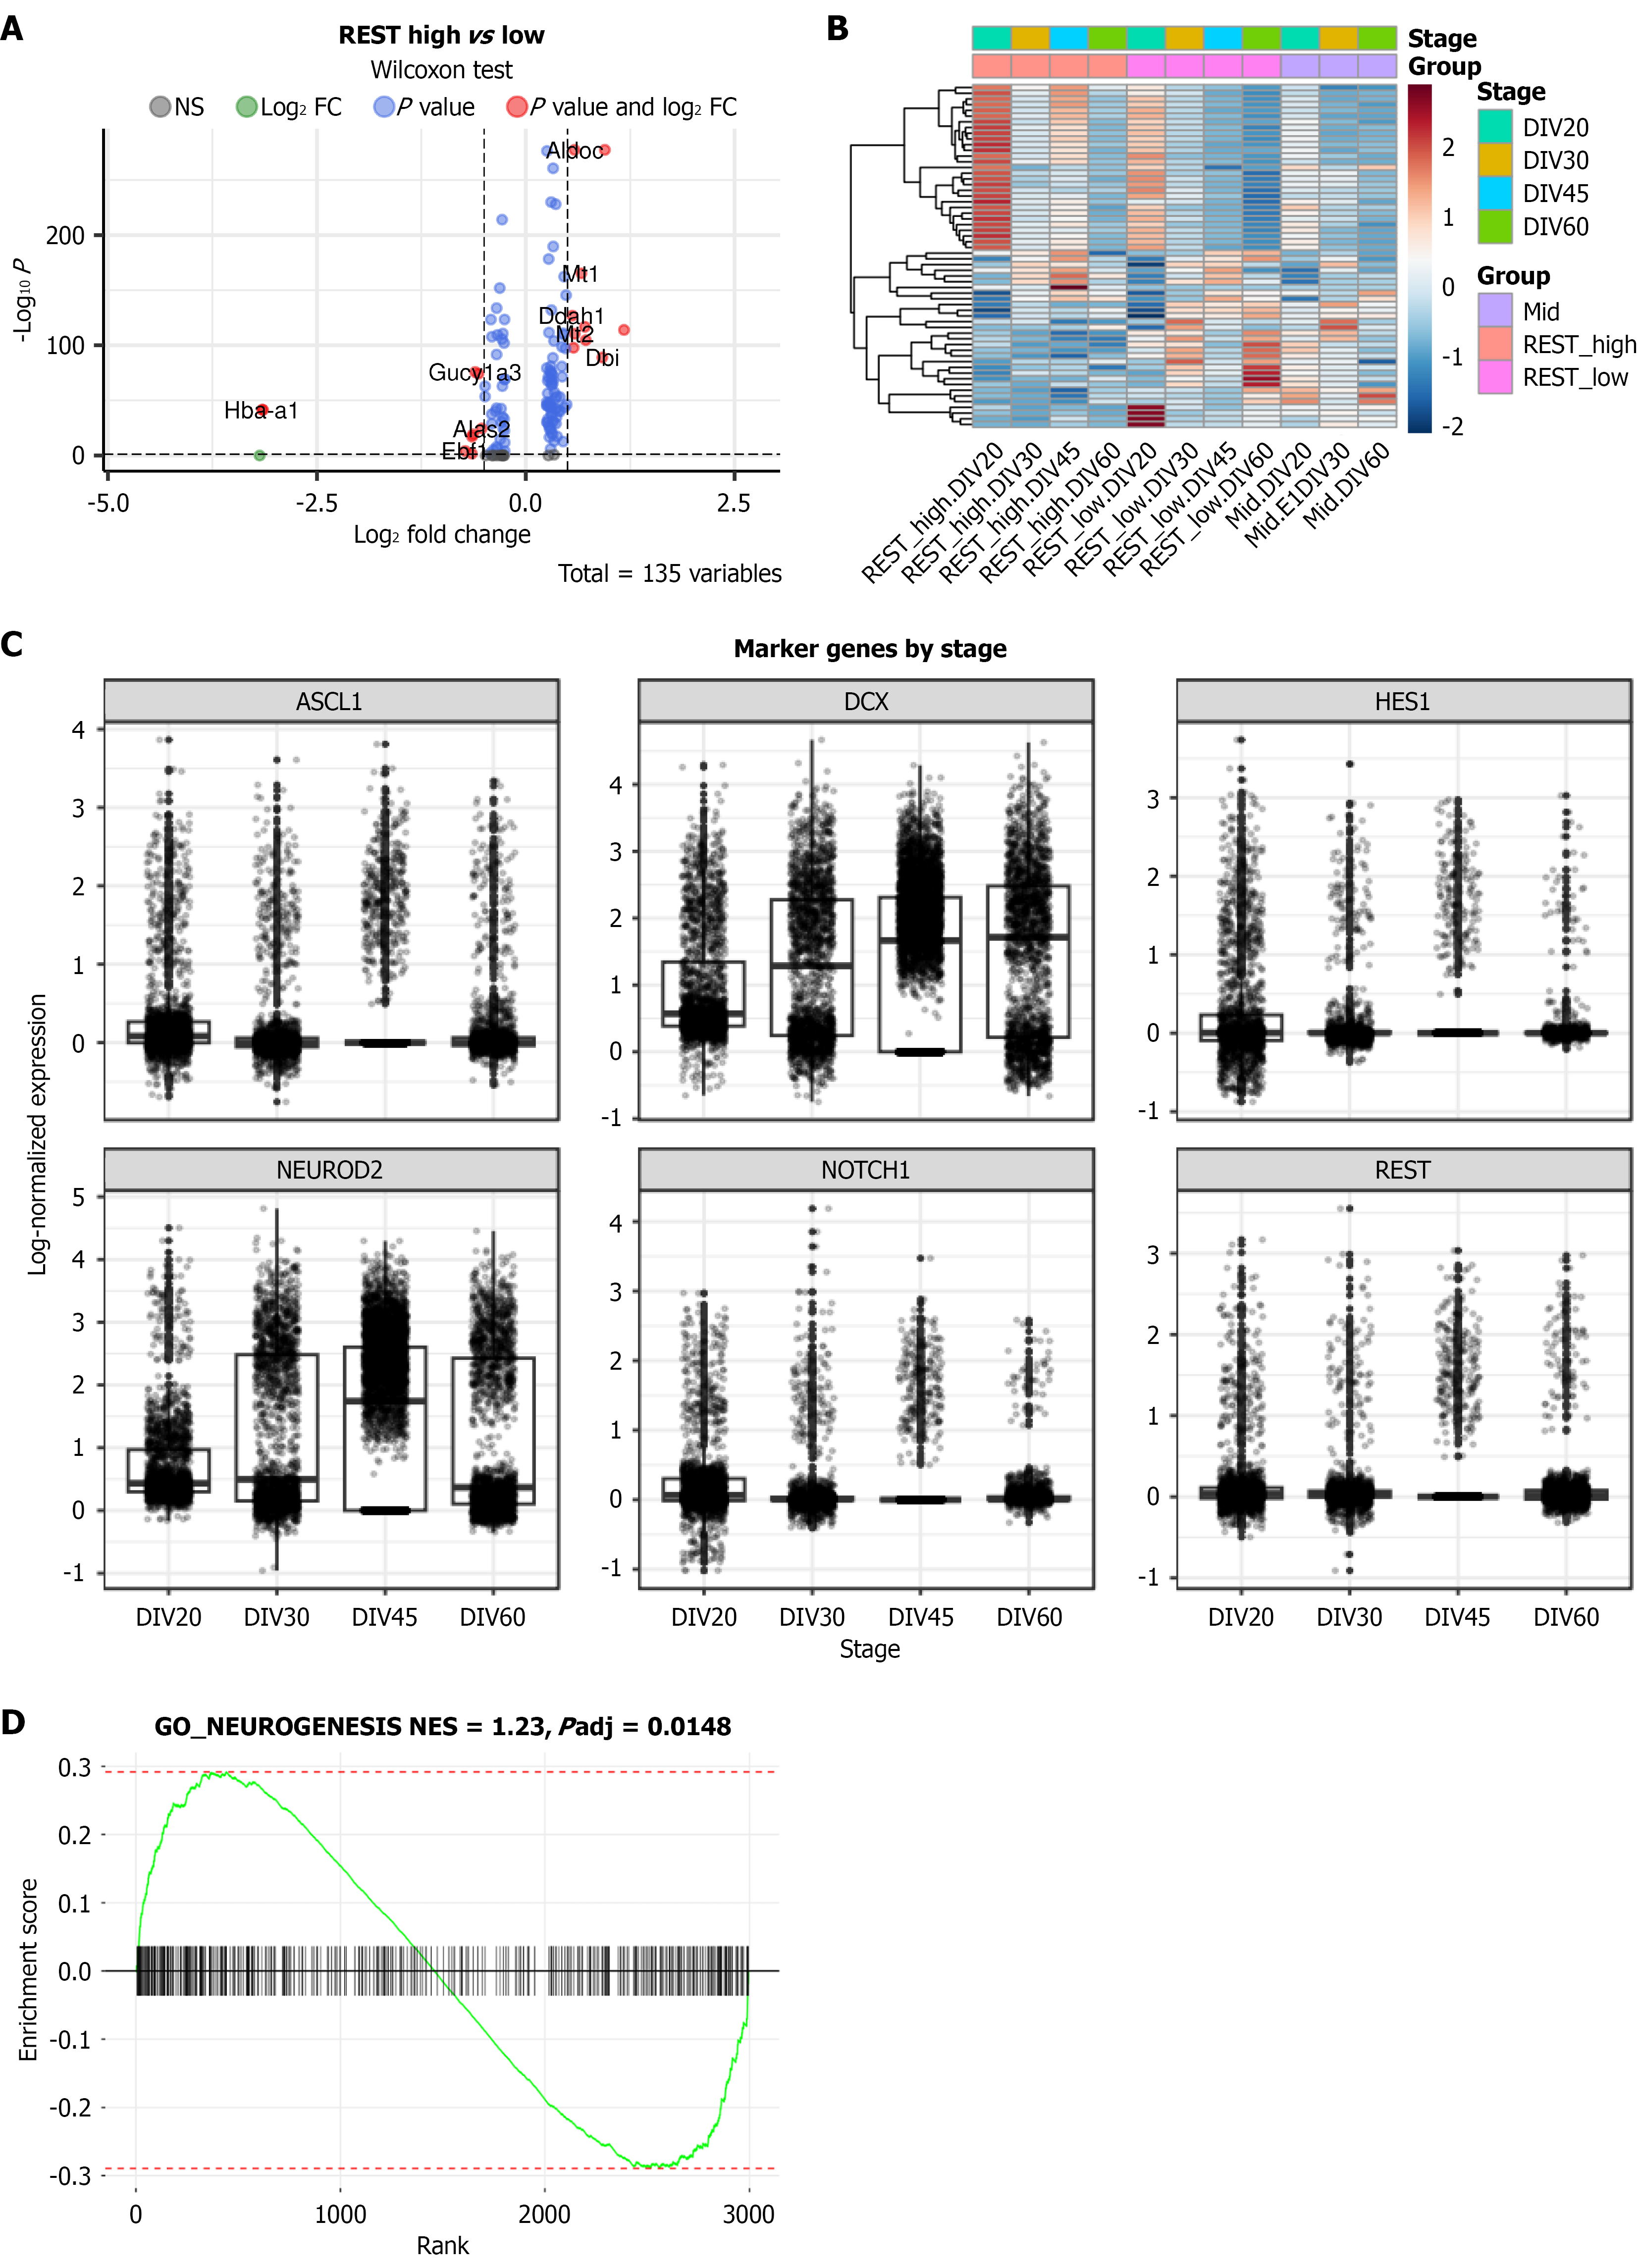
Figure 7 Single-cell RNA sequencing of organoids reveal RE1-silencing transcription factor activity variations and their association with neurogenesis.
A: Volcano plot illustrating the differentially expressed genes between RE1-silencing transcription factor (REST) high-expression and low-expression groups; B: Heatmap of differentially expressed genes between REST high- and low-expression cells. Data were integrated and normalized across developmental stages (DIV20, DIV30, DIV45, DIV60), and visualized using hierarchical clustering; C: Expression profiles of key developmental marker genes (ASCL1, DCX, HES1, NEUROD2, neurogenic locus notch homolog protein 1, REST) across different developmental stages; D: Gene set enrichment analysis enrichment curve for the neurogenesis-related gene set (GO_NEUROGENESIS), calculated based on ranked differential gene expression, showing significant enrichment of neurogenesis pathways in REST low-expression cells. REST: RE1-silencing transcription factor.
- Citation: Xie ZC, Zhao XY, Xiong RH, Zhang XL, Yang W. Dynamic regulation of neural stem cell state transitions by NOTCH1-REST transcriptional axis. World J Stem Cells 2026; 18(8): 117617
- URL: https://www.wjgnet.com/1948-0210/full/v18/i8/117617.htm
- DOI: https://dx.doi.org/10.4252/wjsc.117617