
















Copyright: ©Author(s) 2026.
World J Stem Cells. Aug 26, 2026; 18(8): 117617
Published online Aug 26, 2026. doi: 10.4252/wjsc.117617
Published online Aug 26, 2026. doi: 10.4252/wjsc.117617
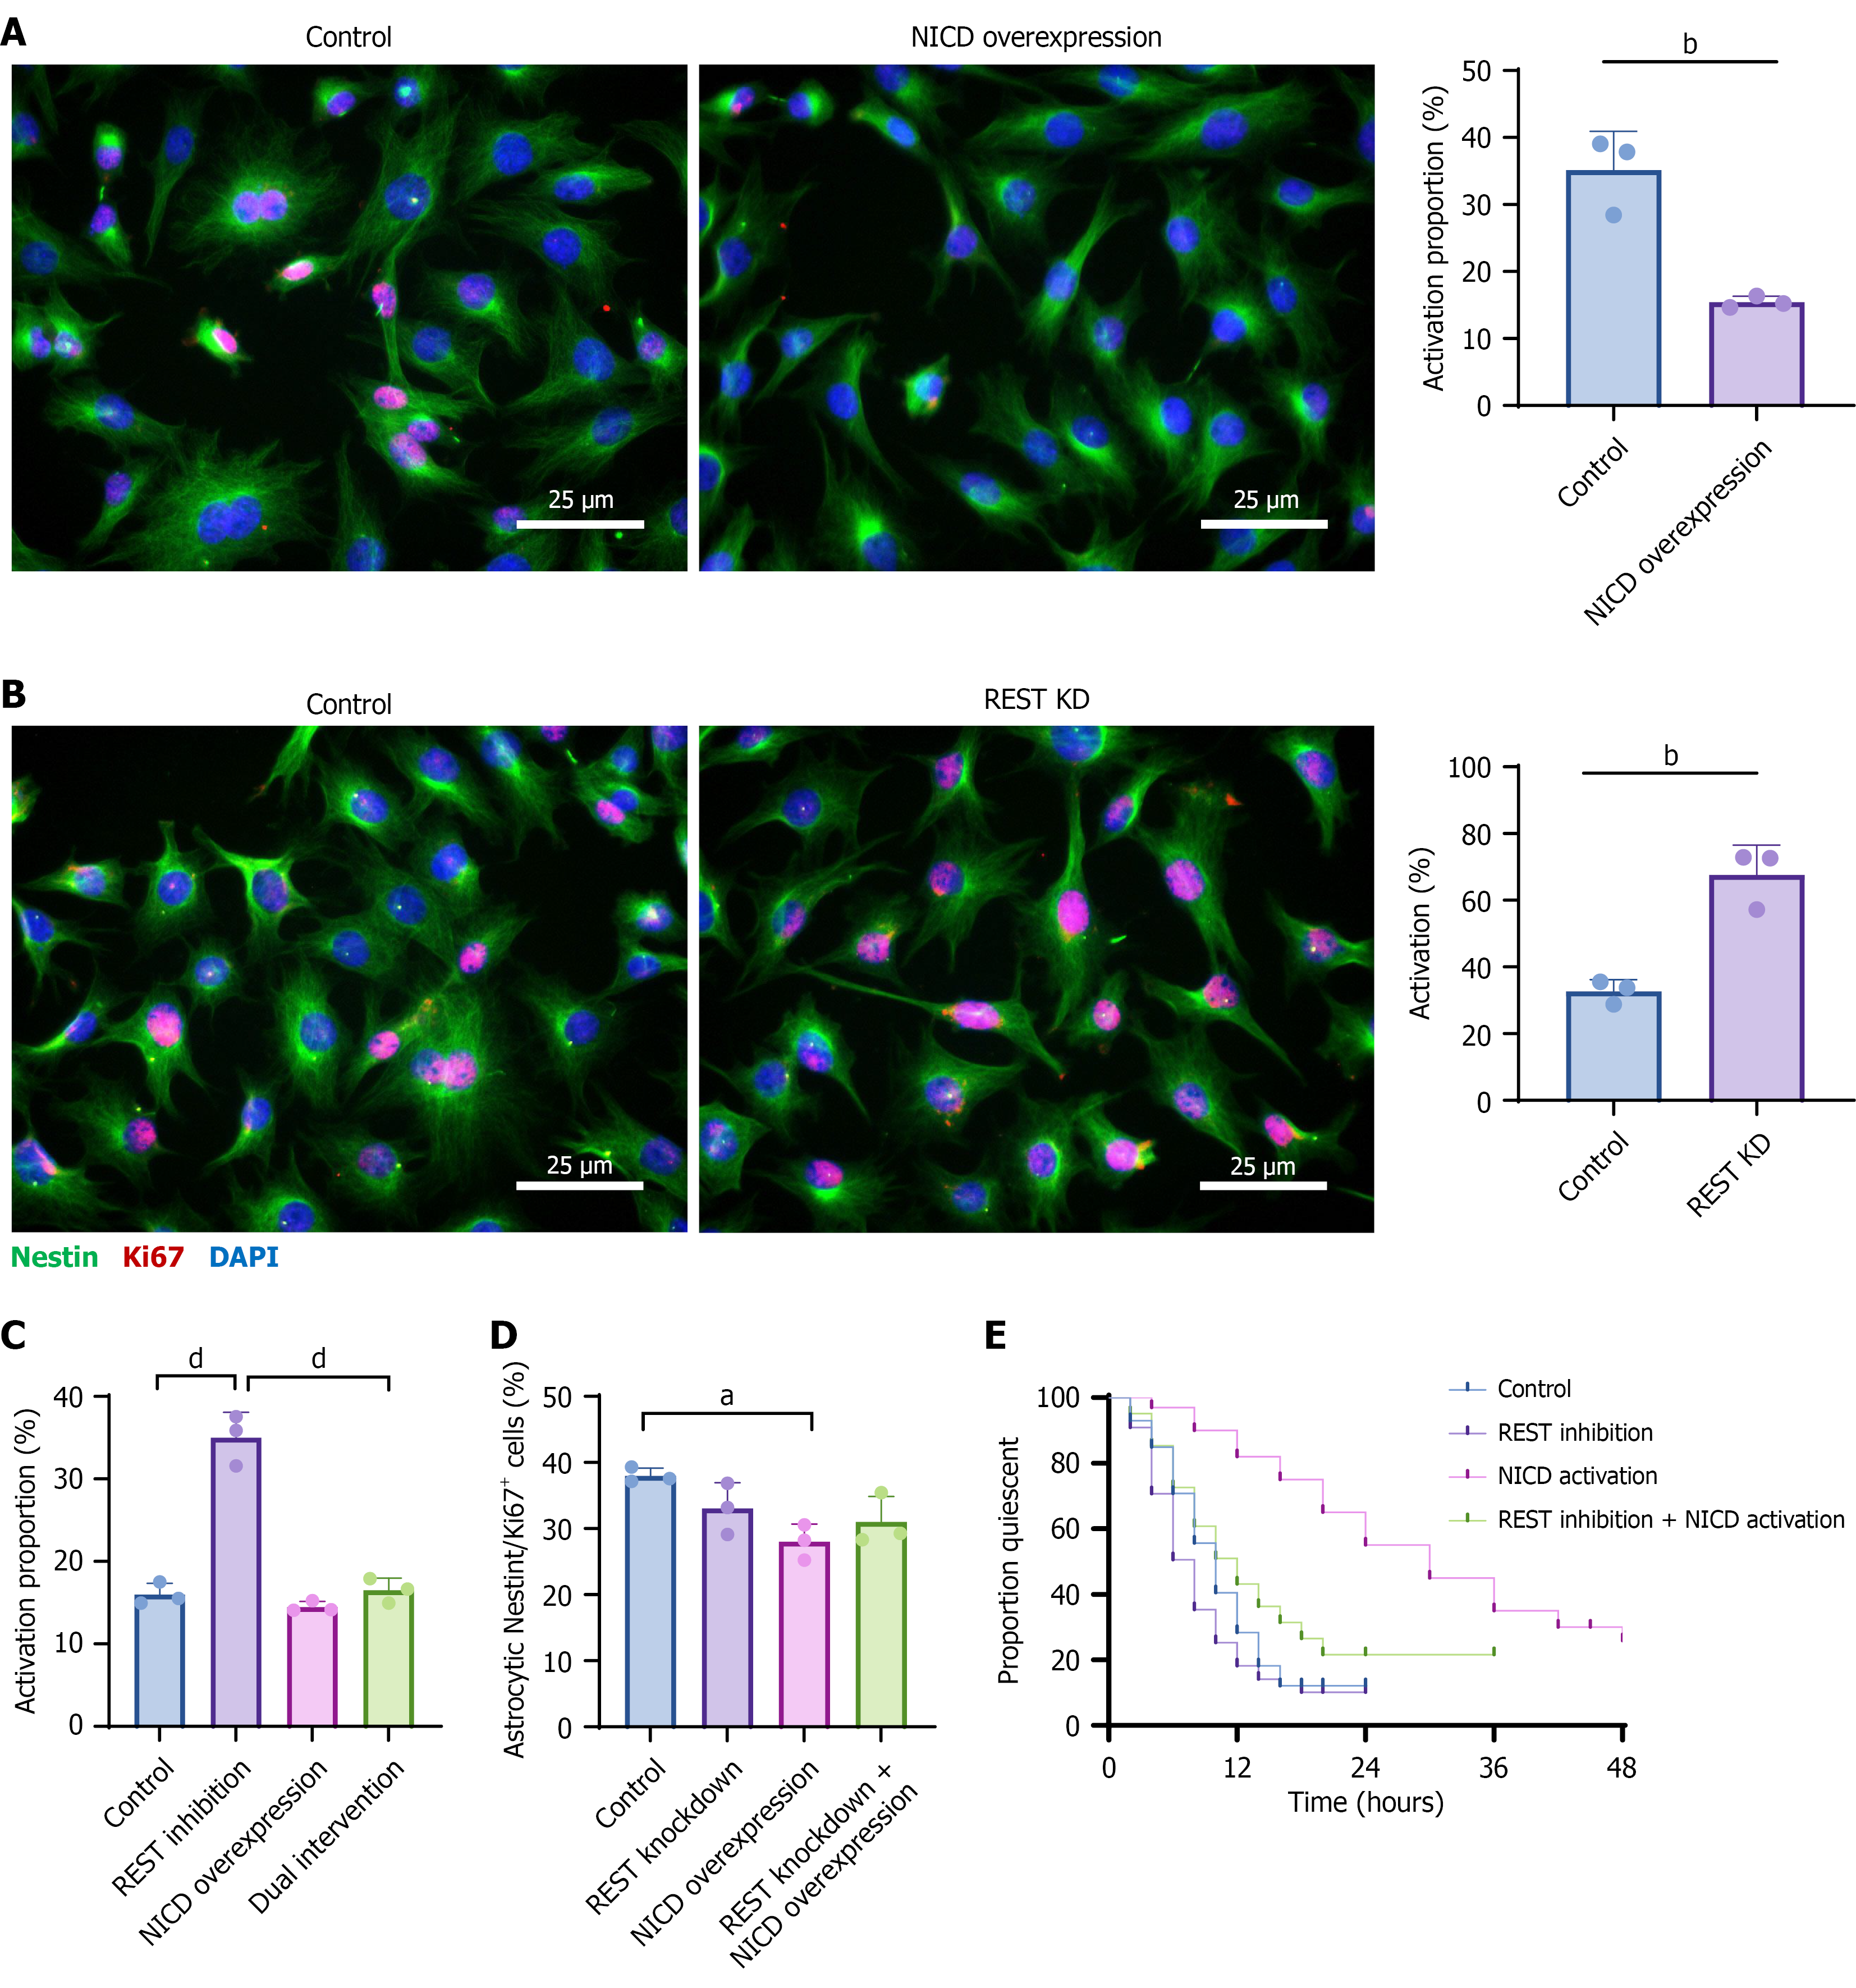
Figure 6 Multiphoton imaging reveals that RE1-silencing transcription factor inhibition accelerates the transition of neural stem cells from dormancy to activation.
A: Representative multiphoton images of Nestin+/Ki67+ cells in the NICD overexpression and control groups at 0 hour and 48 hours (Nestin: Green; Ki67: Red; DAPI: Blue), along with bar graphs showing the proportion of activated cells; B: Representative imaging and quantification of activation proportions in the RE1-silencing transcription factor (REST) inhibition and control groups; C: Comparison of activation rates across four treatment groups (vector control, REST inhibition, NICD activation, dual intervention), with statistical significance indicated; D: Time-course activation curves of neural stem cells based on 48 hours continuous imaging data, showing a marked increase within the first 24 hours in the REST inhibition group and a delayed activation in the NICD activation group; E: Kaplan-Meier-style analysis of neural stem cell activation latency, comparing the time distribution for transition from dormancy to activation across treatment groups. aP < 0.05, bP < 0.01, dP < 0.0001. REST: RE1-silencing transcription factor.
- Citation: Xie ZC, Zhao XY, Xiong RH, Zhang XL, Yang W. Dynamic regulation of neural stem cell state transitions by NOTCH1-REST transcriptional axis. World J Stem Cells 2026; 18(8): 117617
- URL: https://www.wjgnet.com/1948-0210/full/v18/i8/117617.htm
- DOI: https://dx.doi.org/10.4252/wjsc.117617