
















Copyright: ©Author(s) 2026.
World J Stem Cells. Aug 26, 2026; 18(8): 117617
Published online Aug 26, 2026. doi: 10.4252/wjsc.117617
Published online Aug 26, 2026. doi: 10.4252/wjsc.117617
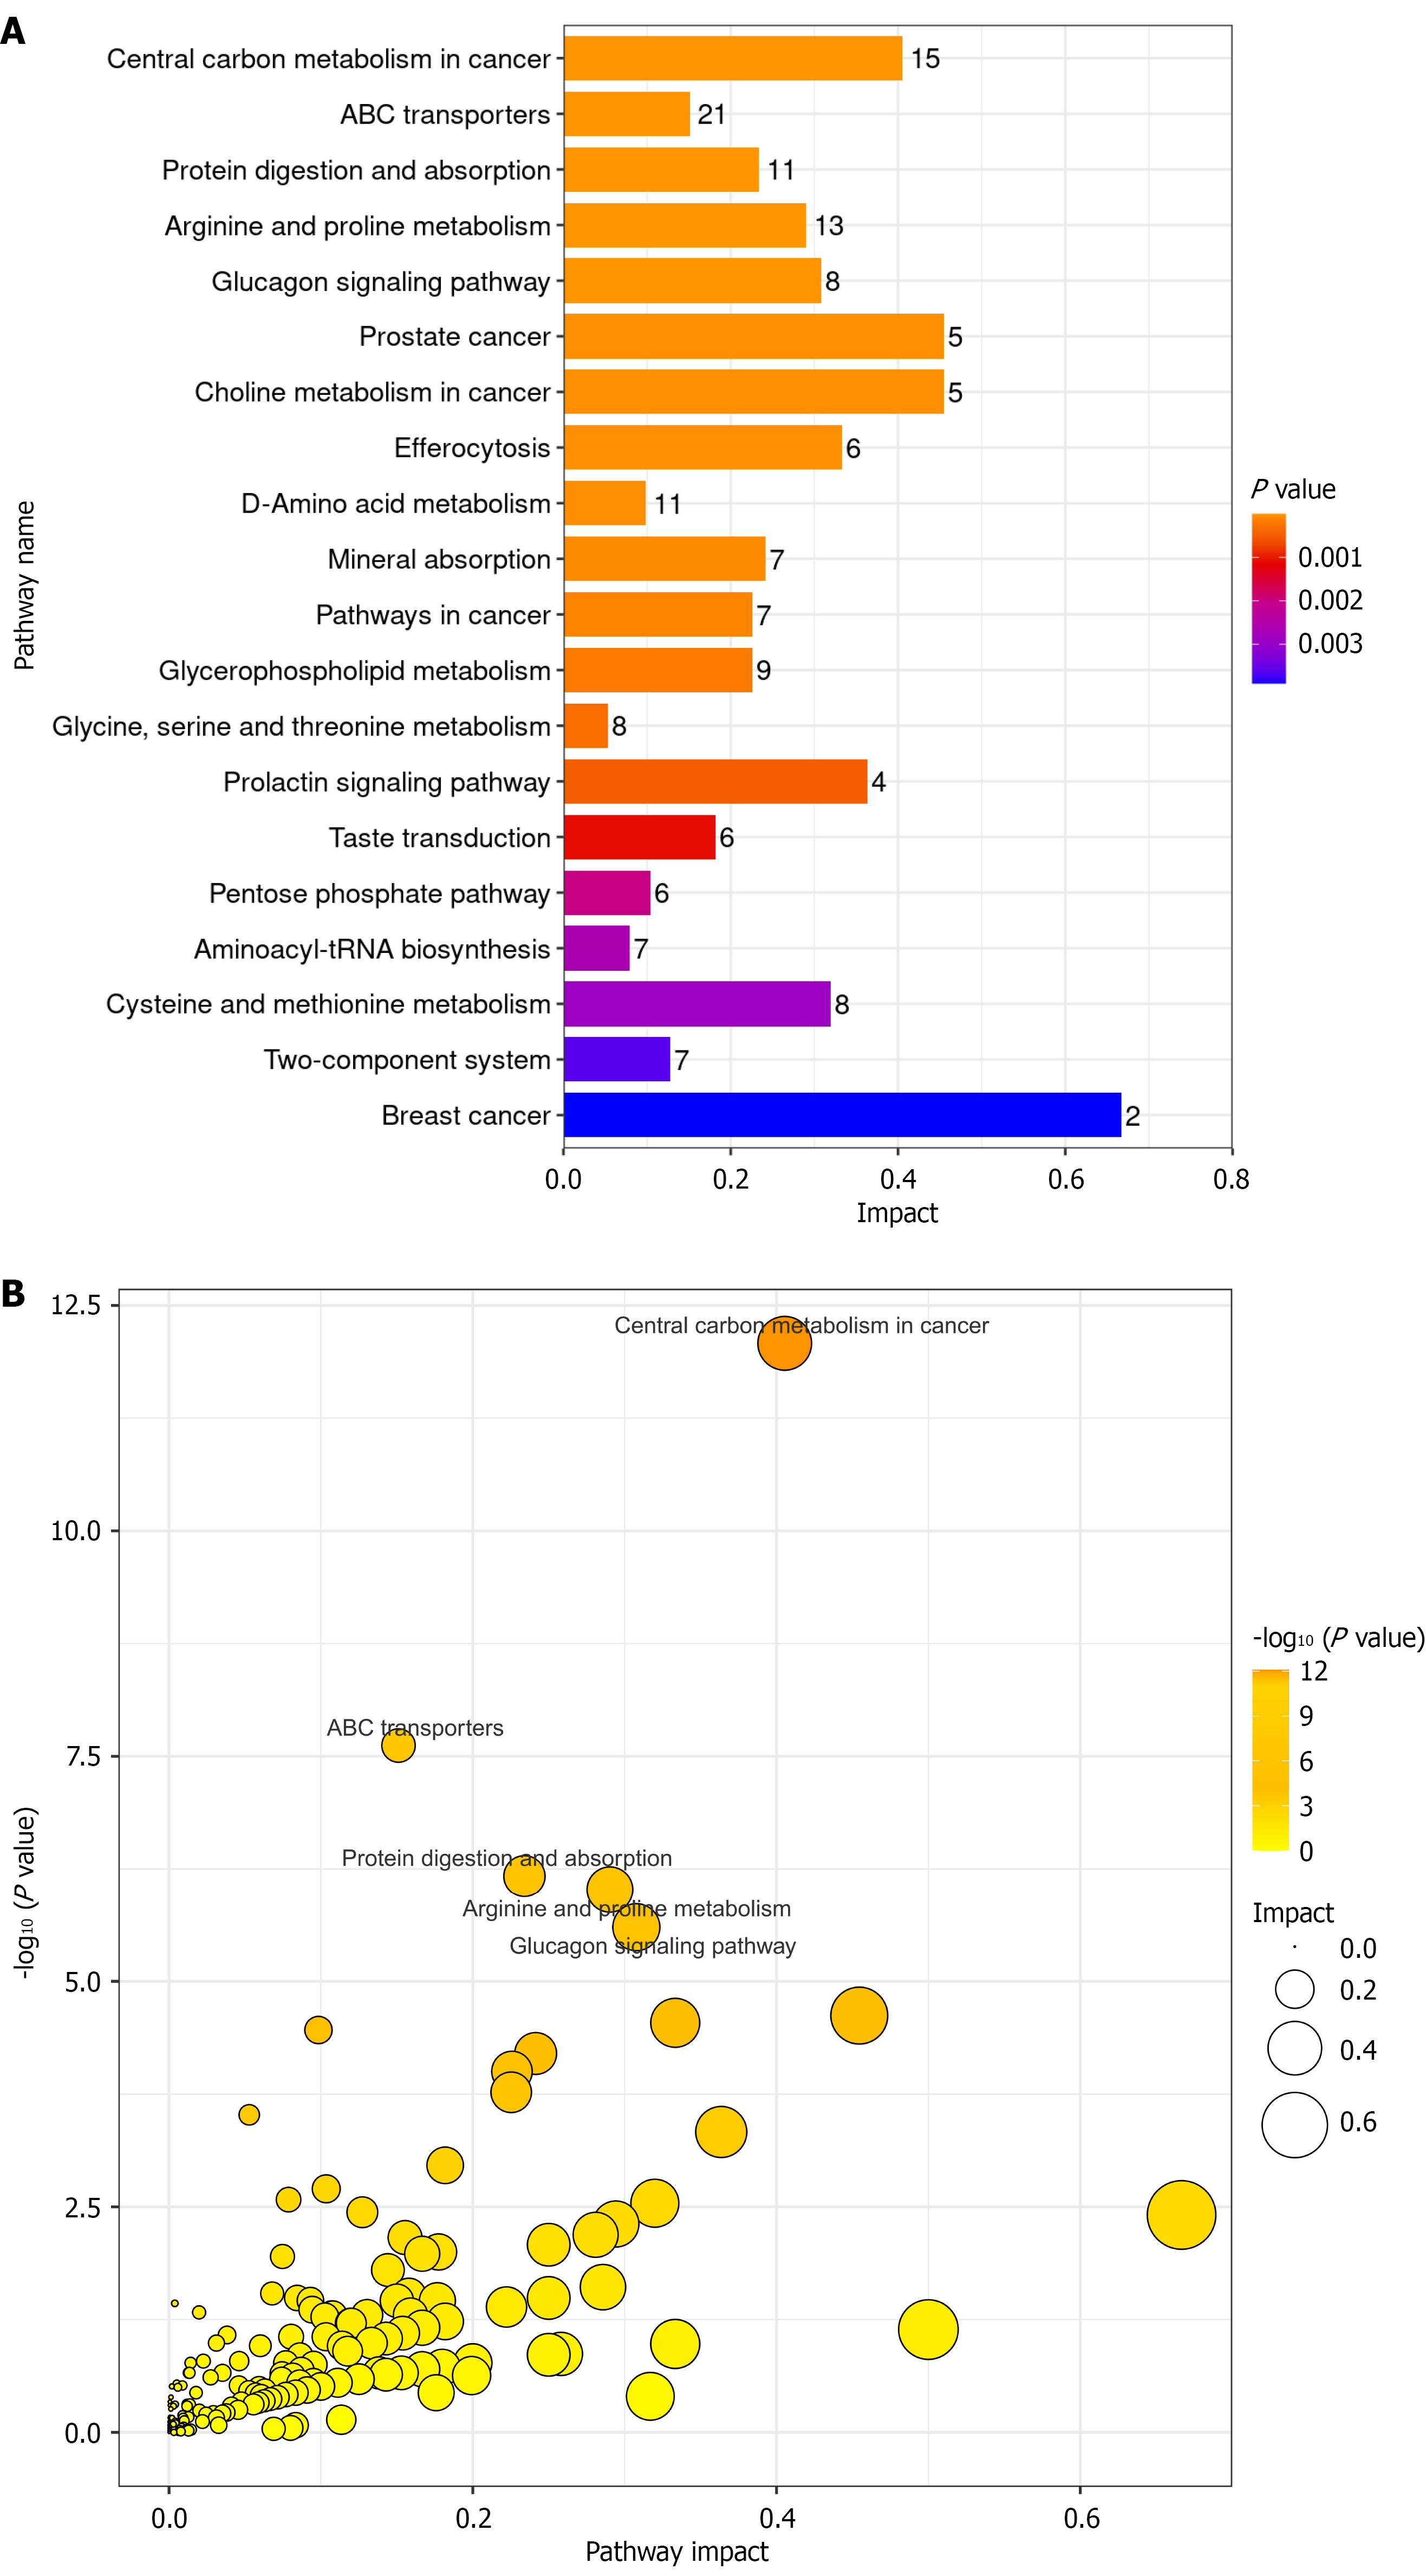
Figure 5 Enrichment and distribution analysis of metabolic pathways affected by RE1-silencing transcription factor inhibition in human neural stem cells.
A: Bar plot of enriched differential metabolic pathways between RE1-silencing transcription factor inhibition and control groups. Differential metabolites were identified via liquid chromatography tandem mass spectrometry and analyzed for Kyoto Encyclopedia of Genes and Genomes pathway enrichment using the BioDeep platform. Enrichment significance is expressed as -log10(P); B: Bubble plot displaying enriched differential pathways. Significance [-log10(P)] and impact values were calculated via topological analysis; bubble size corresponds to the number of differential metabolites involved in each pathway. Data were obtained from four independent biological replicates per group (n = 4 per group; total n = 8).
- Citation: Xie ZC, Zhao XY, Xiong RH, Zhang XL, Yang W. Dynamic regulation of neural stem cell state transitions by NOTCH1-REST transcriptional axis. World J Stem Cells 2026; 18(8): 117617
- URL: https://www.wjgnet.com/1948-0210/full/v18/i8/117617.htm
- DOI: https://dx.doi.org/10.4252/wjsc.117617