
















Copyright: ©Author(s) 2026.
World J Stem Cells. Aug 26, 2026; 18(8): 117617
Published online Aug 26, 2026. doi: 10.4252/wjsc.117617
Published online Aug 26, 2026. doi: 10.4252/wjsc.117617
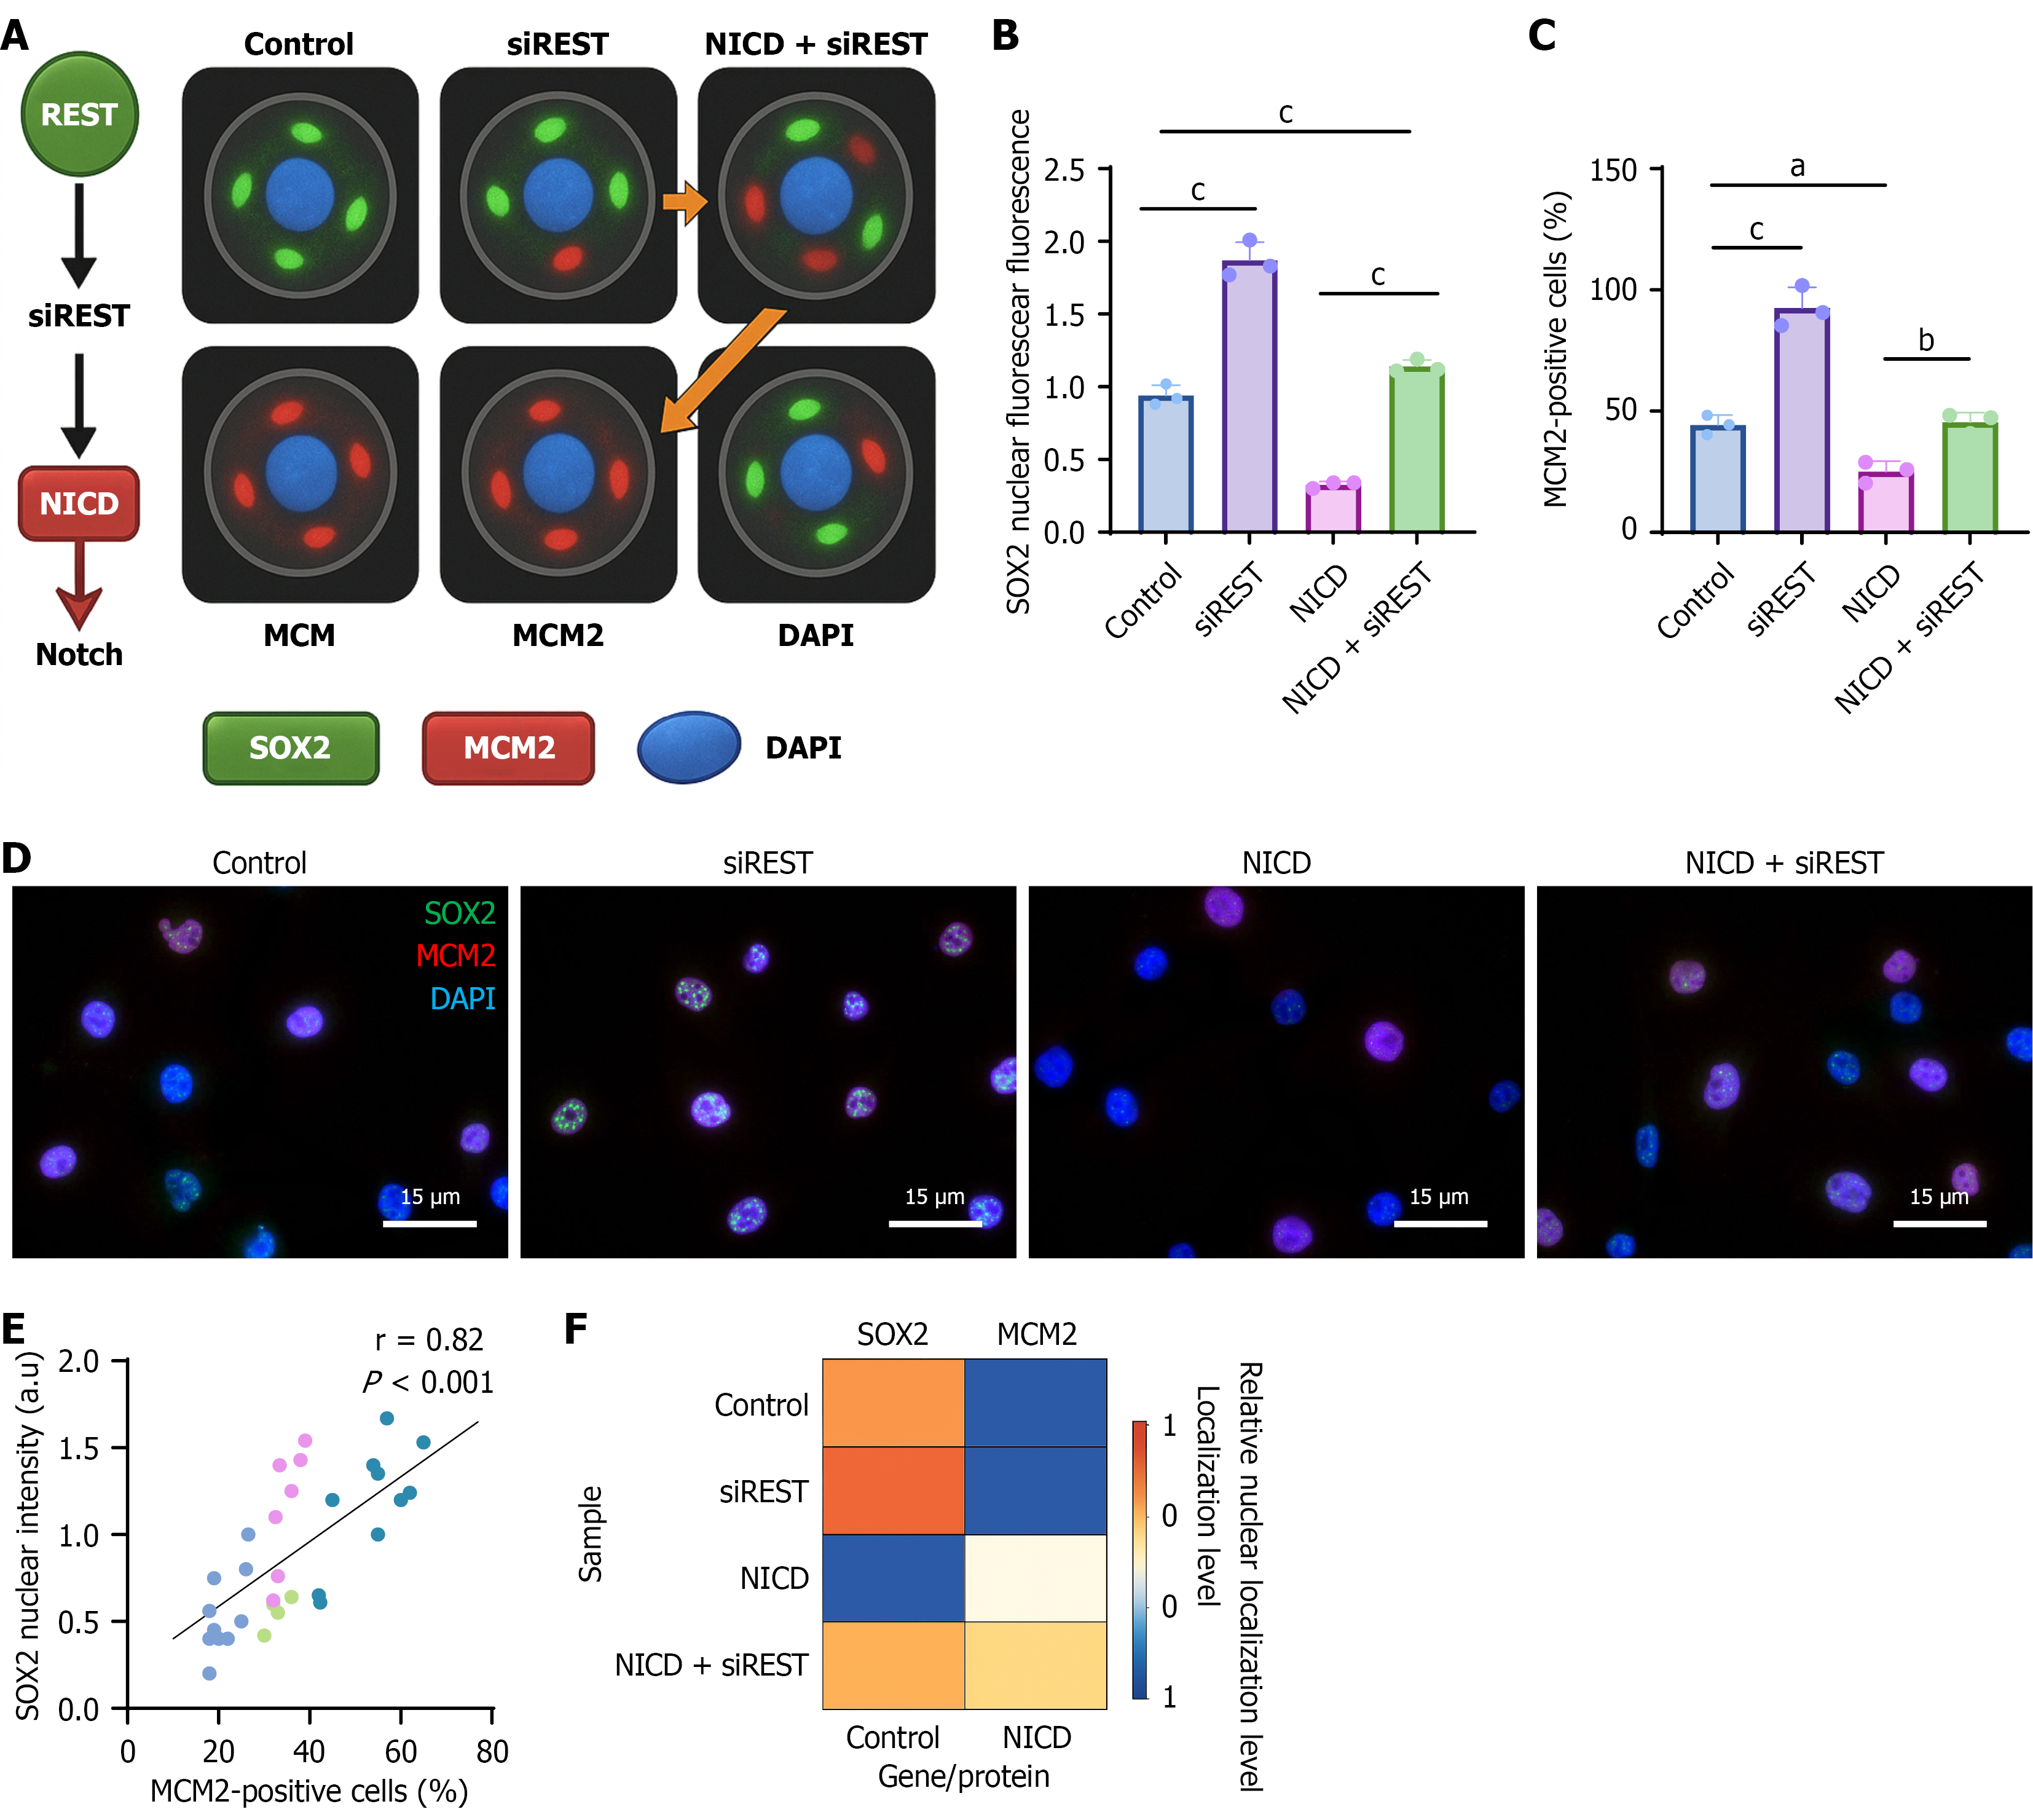
Figure 4 Nuclear localization changes of SOX2 and MCM2 under RE1-silencing transcription factor and Notch signaling regulation.
A: Schematic diagram illustrating the regulatory mechanism; B: Quantification of nuclear fluorescence intensity of SOX2 across groups, presented as bar plots; statistical significance was determined by two-tailed t-test; C: Bar graph showing the percentage of MCM2-positive cells in each group; D: Representative high-magnification images demonstrating enhanced nuclear accumulation of SOX2 in the RE1-silencing transcription factor interference group (white arrows); E: Pearson correlation scatter plot with fitted curve illustrating the relationship between SOX2 nuclear intensity and the proportion of MCM2-positive cells; F: Heatmap of SOX2 and MCM2 nuclear localization levels. Colors represent relative expression levels; rows indicate samples, and columns denote gene/protein signal channels. aP < 0.05, bP < 0.01, cP < 0.001. REST: RE1-silencing transcription factor.
- Citation: Xie ZC, Zhao XY, Xiong RH, Zhang XL, Yang W. Dynamic regulation of neural stem cell state transitions by NOTCH1-REST transcriptional axis. World J Stem Cells 2026; 18(8): 117617
- URL: https://www.wjgnet.com/1948-0210/full/v18/i8/117617.htm
- DOI: https://dx.doi.org/10.4252/wjsc.117617