
















Copyright: ©Author(s) 2026.
World J Stem Cells. Aug 26, 2026; 18(8): 117617
Published online Aug 26, 2026. doi: 10.4252/wjsc.117617
Published online Aug 26, 2026. doi: 10.4252/wjsc.117617
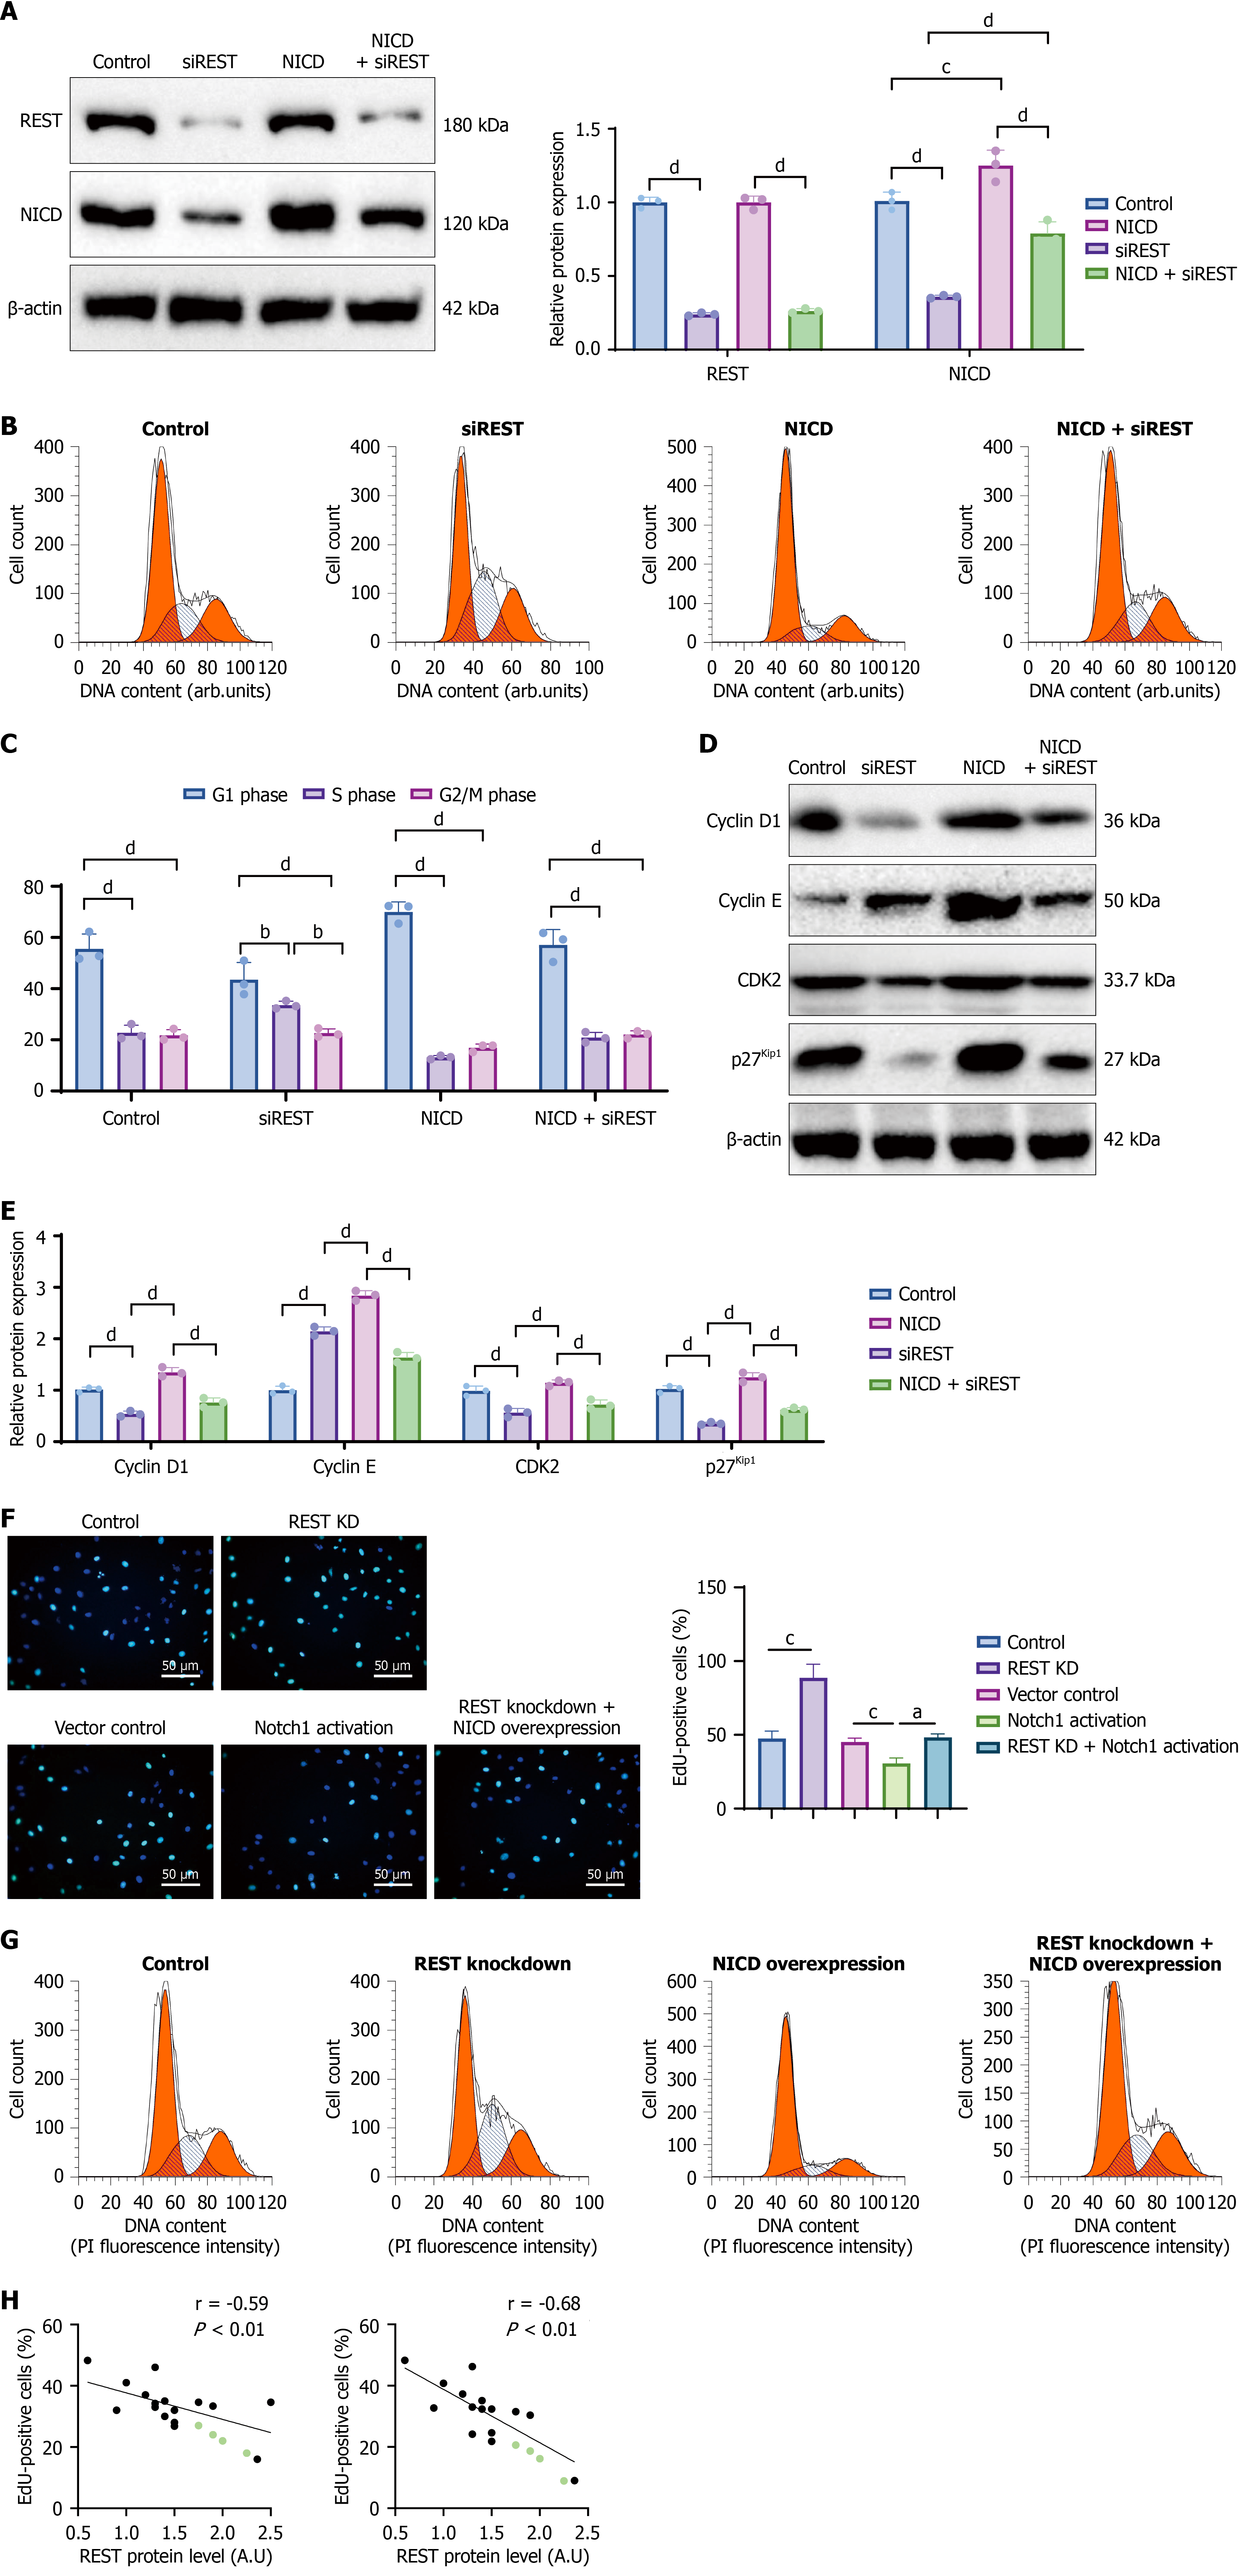
Figure 2 Antagonistic effects of RE1-silencing transcription factor and neurogenic locus notch homolog protein 1 on cell cycle regulation in neural stem cells.
A: Western blot analysis was performed to detect the expression of RE1-silencing transcription factor and NICD in each group, with β-actin used as the internal control; B: Representative histograms from flow cytometry analysis showing cell cycle distribution across experimental groups; C: Quantitative analysis of the proportion of cells in G1, S, and G2/M phases; D: Western blot analysis of cyclin D1, cyclin E, CDK2, and p27Kip1 protein levels; β-actin served as the loading control; E: QPCR analysis of CDC6 and MCM2 mRNA expression levels (normalized to GAPDH); F: Representative EdU staining images across treatment groups. EdU-positive cells indicate proliferating cells, and nuclei were counterstained with DAPI; G: Flow cytometry analysis of cell cycle distribution based on propidium iodide staining; H: Scatter plot of Pearson correlation between RE1-silencing transcription factor/neurogenic locus notch homolog protein 1 protein levels and the proportion of EdU-positive cells. Data are presented as mean ± SD from three independent biological replicates. Statistical analyses were performed using one-way ANOVA followed by Tukey’s post hoc test or two-tailed Student’s t-test where appropriate. aP < 0.05, bP < 0.01, cP < 0.001, dP < 0.0001. REST: RE1-silencing transcription factor.
- Citation: Xie ZC, Zhao XY, Xiong RH, Zhang XL, Yang W. Dynamic regulation of neural stem cell state transitions by NOTCH1-REST transcriptional axis. World J Stem Cells 2026; 18(8): 117617
- URL: https://www.wjgnet.com/1948-0210/full/v18/i8/117617.htm
- DOI: https://dx.doi.org/10.4252/wjsc.117617