
















Copyright: ©Author(s) 2026.
World J Stem Cells. Jul 26, 2026; 18(7): 120578
Published online Jul 26, 2026. doi: 10.4252/wjsc.120578
Published online Jul 26, 2026. doi: 10.4252/wjsc.120578
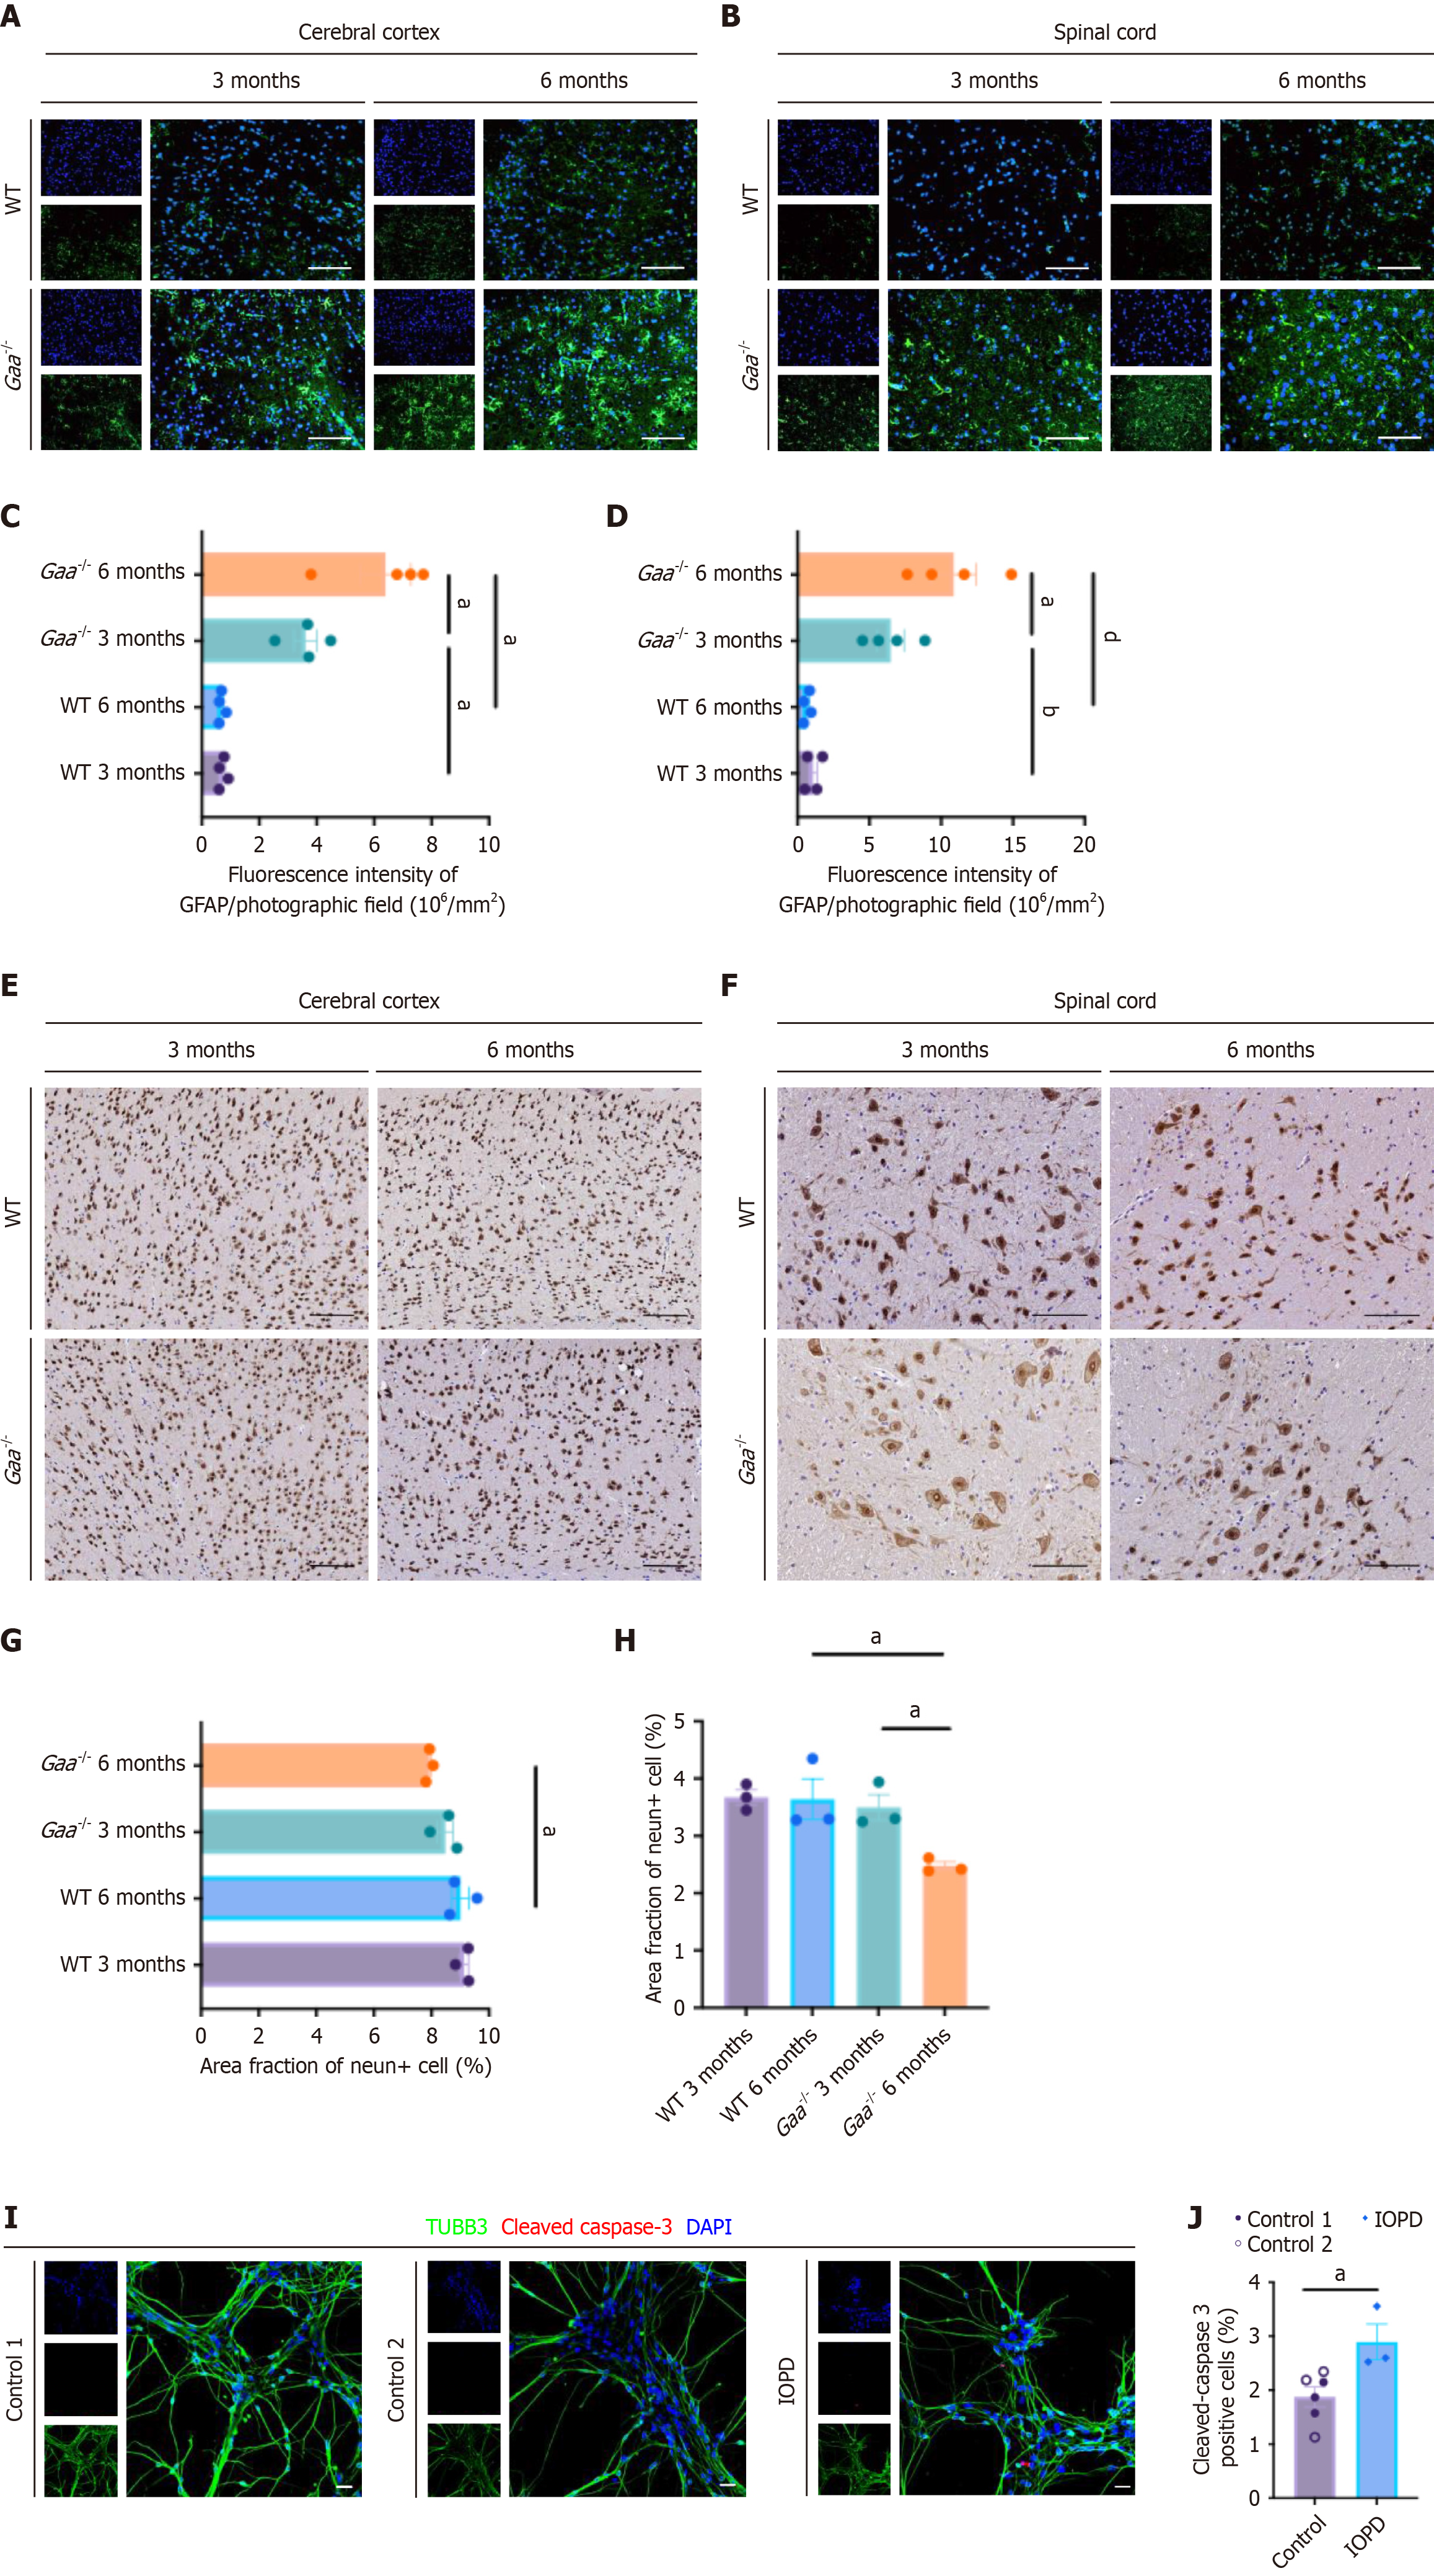
Figure 4 Progressive neurodegeneration in Gaa-/- mice and patient-derived neural cultures.
A: Representative GFAP immunofluorescence images of the cerebral cortex from 3- and 6-month-old wild-type (WT) and Gaa-/- mice. Scale bar = 100 μm; B: Representative GFAP immunofluorescence images of the spinal cord from 3- and 6-month-old WT and Gaa-/- mice. Scale bar = 100 μm; C: Quantification of GFAP fluorescence intensity in the cerebral cortex shown in A (n = 4 mice per group; data are presented as mean ± SEM; aP < 0.05, WT 3 months vs Gaa-/- 3 months; aP < 0.05, WT 6 months vs Gaa-/- 6 months; aP < 0.05, Gaa-/- 3 months vs Gaa-/- 6 months; one-way ANOVA); D: Quantification of GFAP fluorescence intensity in the spinal cord shown in B (n = 4 mice per group; data are presented as mean ± SEM; bP < 0.01, WT 3 months vs Gaa-/- 3 months; dP < 0.0001, WT 6 months vs Gaa-/- 6 months; aP < 0.05, Gaa-/- 3 months vs Gaa-/- 6 months; one-way ANOVA); E: Representative NeuN immunostaining of the cerebral cortex from 3- and 6-month-old WT and Gaa-/- mice. Scale bar = 100 μm; F: Representative NeuN immunostaining of the spinal cord from 3- and 6-month-old WT and Gaa-/- mice. Scale bar = 100 μm; G: Quantification of the NeuN+ area fraction in the cerebral cortex shown in E (n = 3 mice per group; data are presented as mean ± SEM; aP < 0.05, WT 6 months vs Gaa-/- 6 months; one-way ANOVA); H: Quantification of the NeuN+ area fraction in the spinal cord shown in F (n = 3 mice per group; data are presented as mean ± SEM; aP < 0.05, WT 6 months vs Gaa-/- 6 months; aP < 0.05, Gaa-/- 3 months vs Gaa-/- 6 months; one-way ANOVA); I: Immunofluorescence images of patient - derived induced pluripotent stem cell neurons cultured for 90 days, showing increased cleaved caspase-3 (red) positivity in TUBB3+ neurons (green) compared to controls. Nuclei counterstained with DAPI (blue). Scale bar = 20 μm; J: Quantification of cleaved caspase-3 positivity in TUBB3+ neurons shown in I (n = 3 independent differentiation; data are presented as mean ± SEM; aP < 0.05; unpaired two-tailed Student’s t-test). WT: Wild-type; GAA: Acid α-glucosidase; IOPD: Infantile-onset Pompe disease.
- Citation: Jiao YC, Zhao DD, Zhang HY, Liu FC. Integrated patient induced pluripotent stem cell models and Gaa-/- mice reveal central nervous system neural pathology in infantile-onset Pompe disease. World J Stem Cells 2026; 18(7): 120578
- URL: https://www.wjgnet.com/1948-0210/full/v18/i7/120578.htm
- DOI: https://dx.doi.org/10.4252/wjsc.120578