
















Copyright: ©Author(s) 2026.
World J Stem Cells. Jun 26, 2026; 18(6): 120457
Published online Jun 26, 2026. doi: 10.4252/wjsc.120457
Published online Jun 26, 2026. doi: 10.4252/wjsc.120457
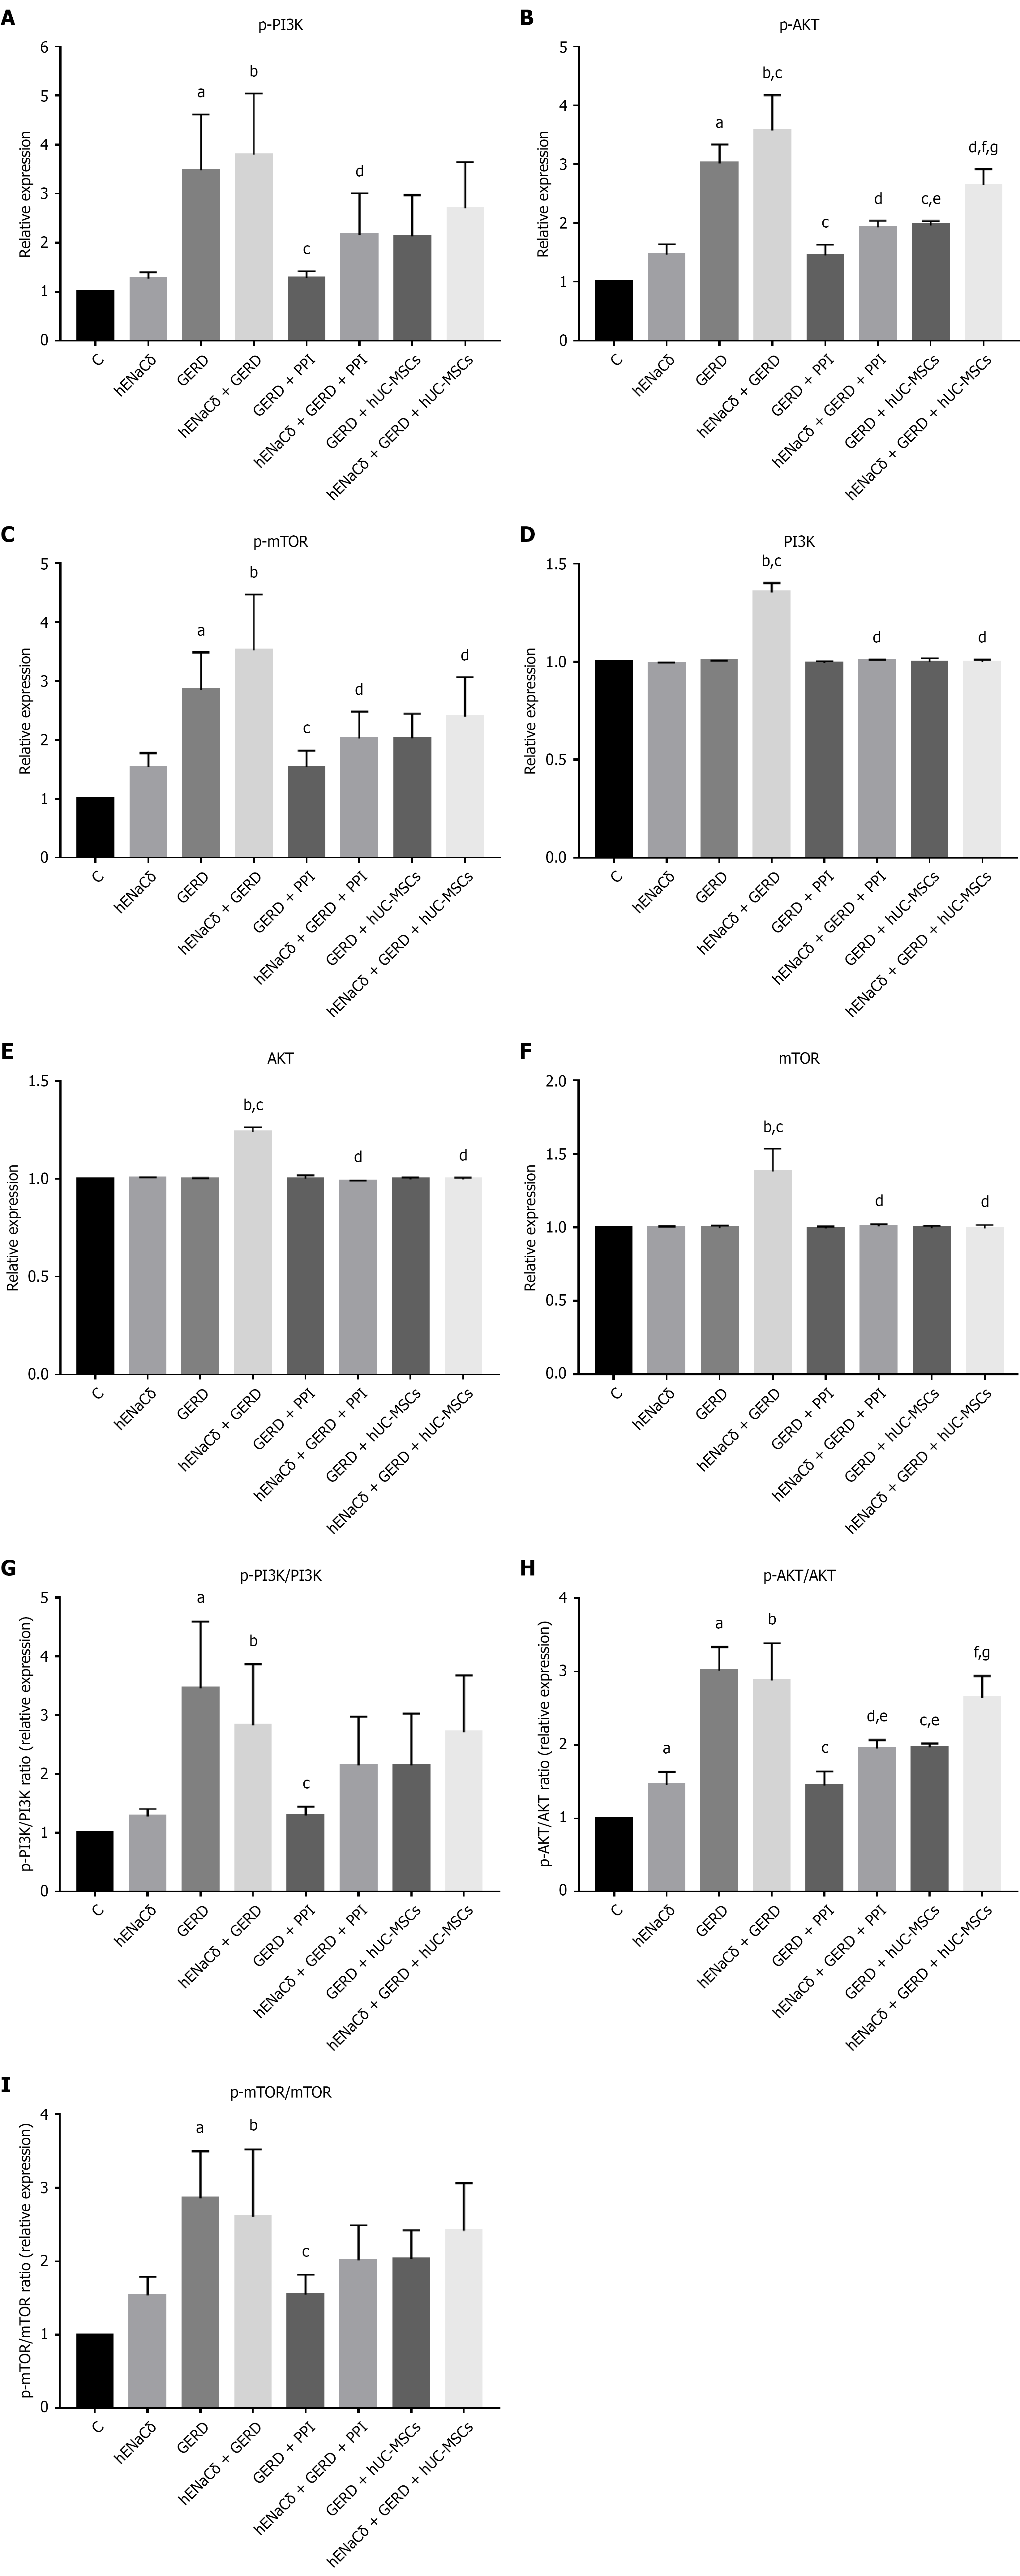
Figure 4 Relative expression levels and phosphorylation levels of phosphoinositide 3-kinase/protein kinase B/mammalian target of rapamycin detected by western blot in mouse esophageal tissue.
Abscissa: Grouping. A-C: Relative expression levels of phosphorylated phosphoinositide 3-kinase/protein kinase B/mammalian target of rapamycin (PI3K/AKT/mTOR) proteins; D-F: Relative expression levels of PI3K/AKT/mTOR proteins; G-I: Ratio of relative expression levels of phosphorylated PI3K/AKT/mTOR proteins to relative expression levels of PI3K/AKT/mTOR proteins. aP < 0.05, compared with group C; bP < 0.05, compared with group hENaCδ; cP < 0.05, compared with group GERD; dP < 0.05, compared with group hENaCδ + GERD; eP < 0.05, compared with group GERD + PPI; fP < 0.05, compared with group hENaCδ + GERD + PPI; gP < 0.05, compared with group GERD + hUC-MSCs. PI3K: Phosphoinositide 3-kinase; AKT: Protein kinase B; mTOR: Mammalian target of rapamycin; C: Wild-type C57BL/6 mic; hENaCδ: Humanized δ subunit of epithelial sodium channel; GERD: Gastroesophageal reflux disease; PPI: Proton pump inhibitor; hUC-MSCs: Human umbilical cord mesenchymal stem cells.
- Citation: Wang C, Li Y, Chen QQ, Wan J. ENaCδ aggravates gastroesophageal reflux disease via PI3K/AKT/mTOR: Human umbilical cord mesenchymal stem cells restore barrier function. World J Stem Cells 2026; 18(6): 120457
- URL: https://www.wjgnet.com/1948-0210/full/v18/i6/120457.htm
- DOI: https://dx.doi.org/10.4252/wjsc.120457