
















Copyright: ©Author(s) 2026.
World J Stem Cells. Jun 26, 2026; 18(6): 119118
Published online Jun 26, 2026. doi: 10.4252/wjsc.119118
Published online Jun 26, 2026. doi: 10.4252/wjsc.119118
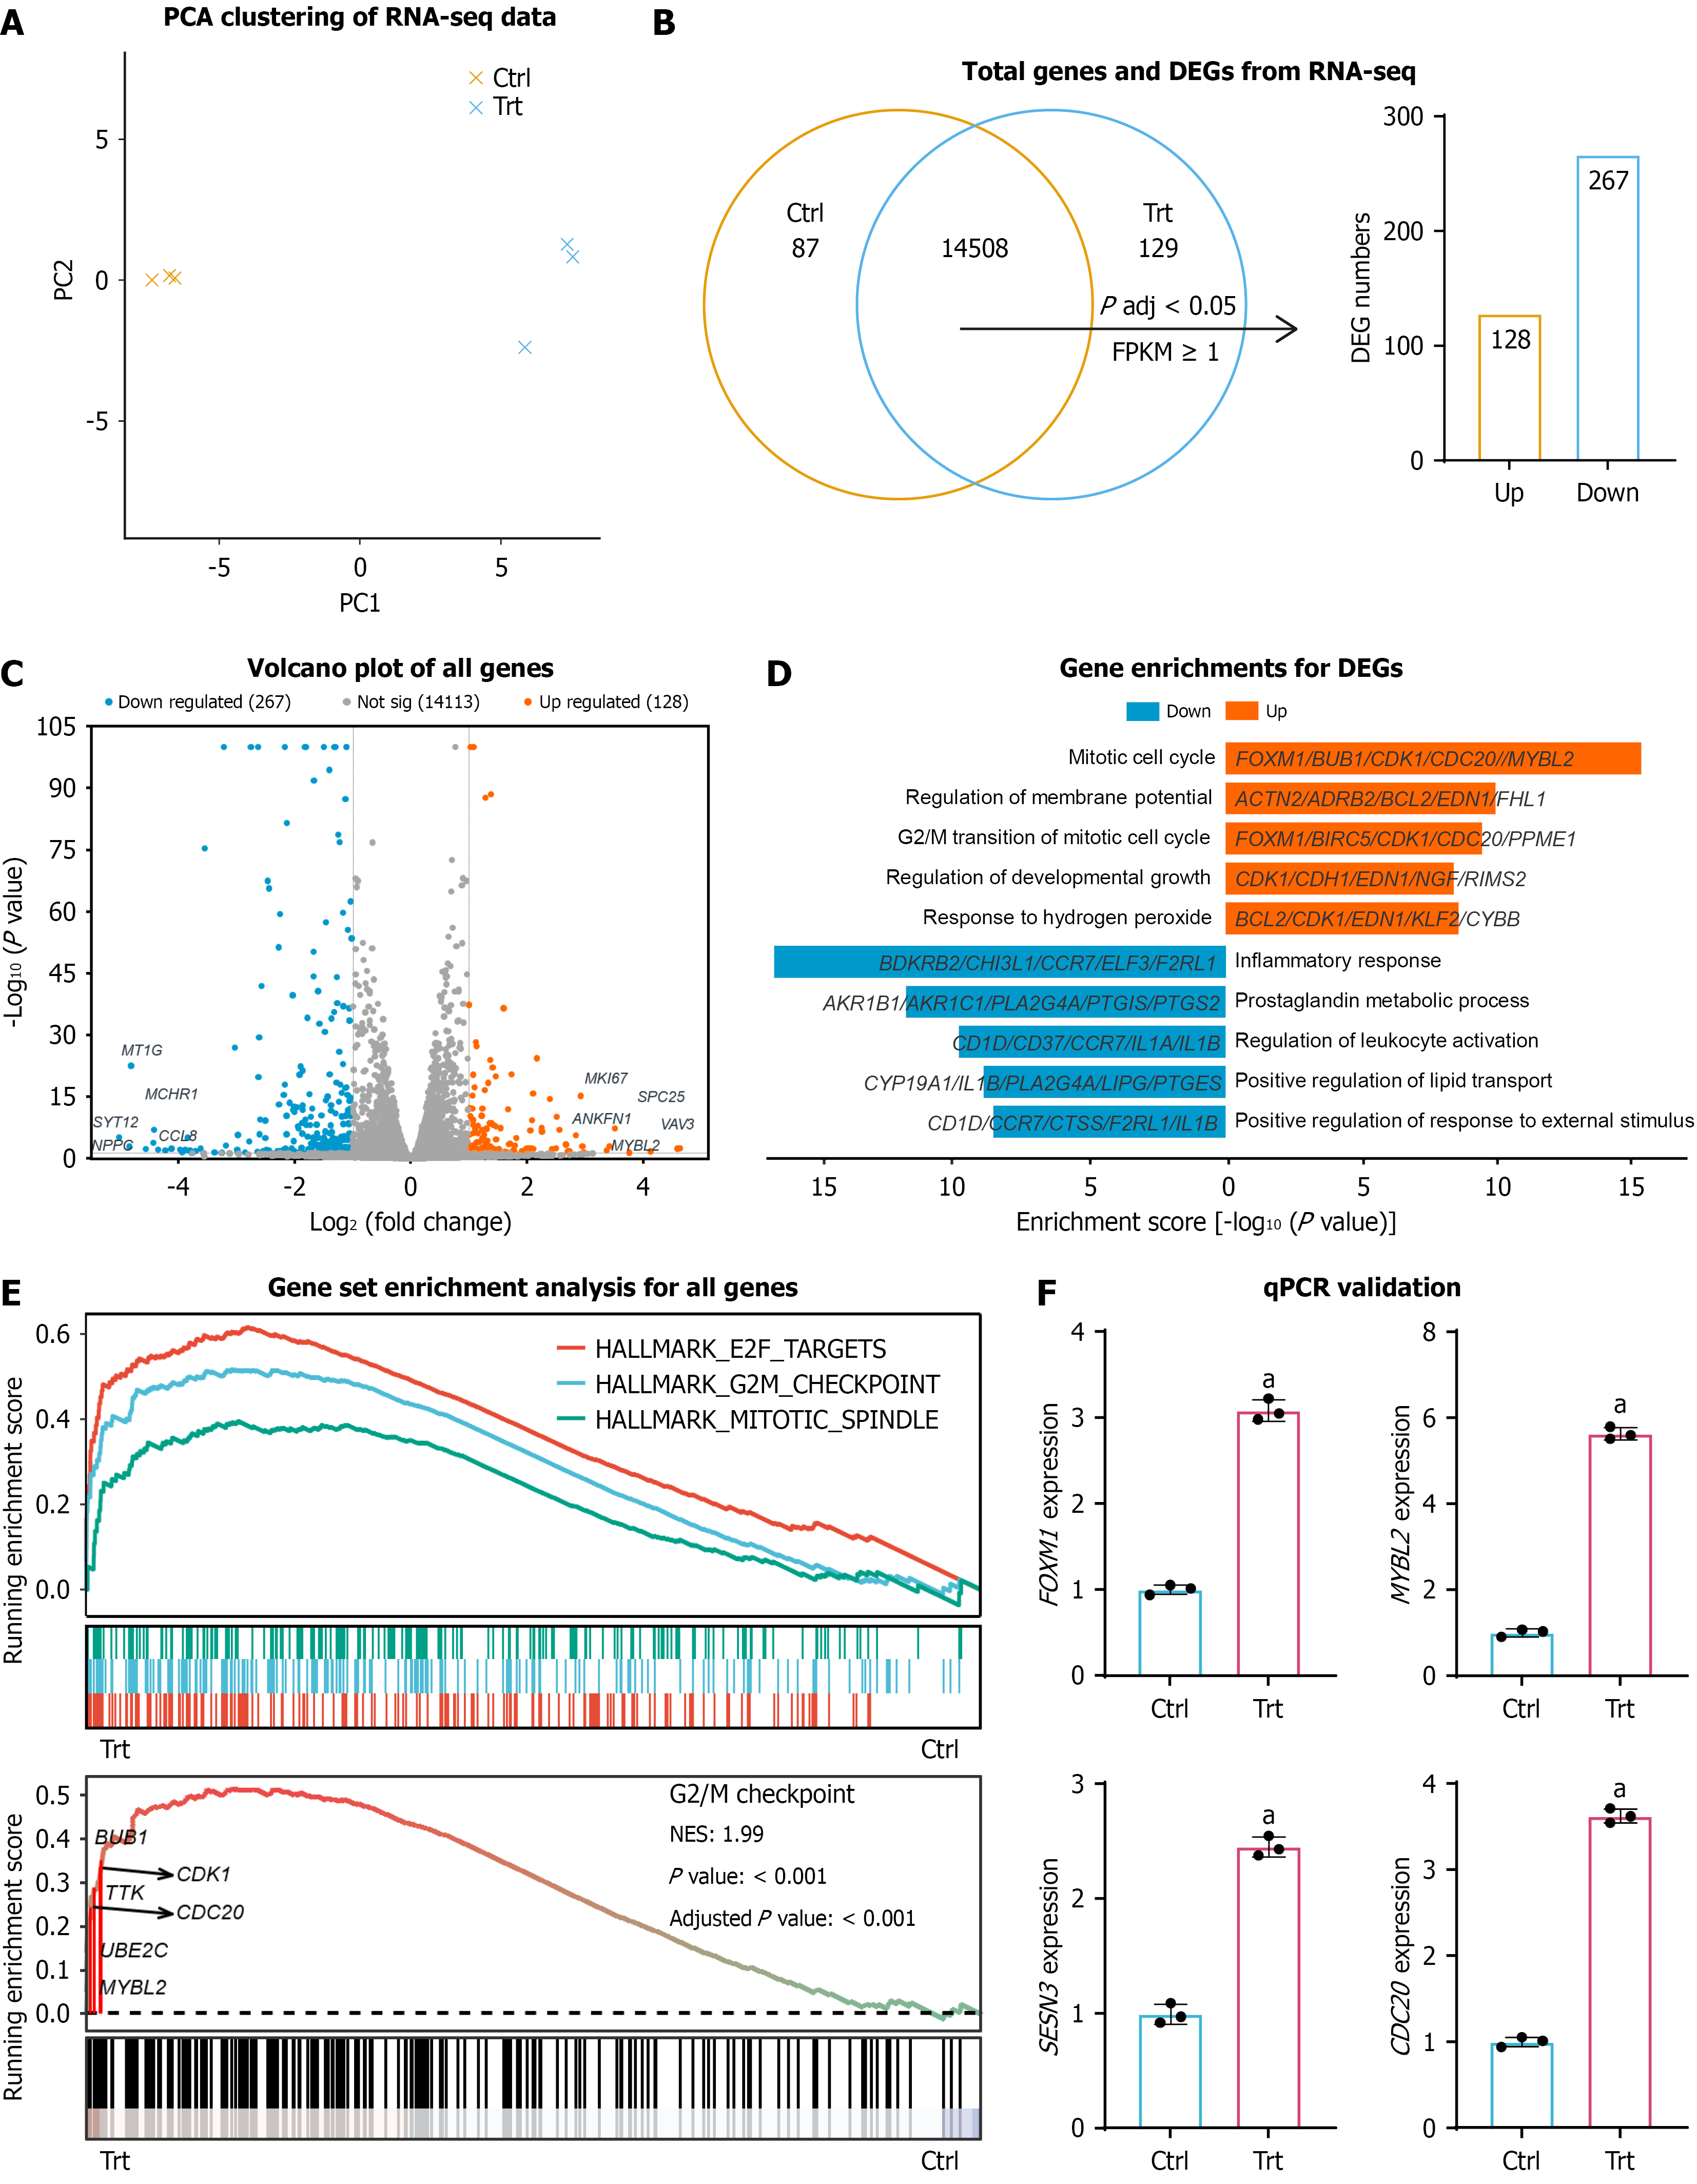
Figure 4 Bulk RNA-seq identifies a forkhead box protein M1-centered mitotic and stress-response program activated by selenoprotein P/selenite co-treatment.
A: PCA of bulk RNA-seq data showing distinct clustering of control and treatment (Trt) samples; B: Summary of differentially expressed genes (DEGs) between control and Trt groups; C: Volcano plot showing global transcriptomic changes, with representative upregulated and downregulated genes labeled; D: Functional enrichment analysis of DEGs showing activation of cell cycle/G2-M pathways and suppression of inflammatory/stress-related pathways in the Trt group; E: Gene Set Enrichment Analysis showing enrichment of mitotic/cell-cycle signatures (including E2F targets, G2/M checkpoint, and mitotic spindle) in the Trt group; F: Quantitative real-time polymerase chain reaction validation of selected targets, including FOXM1, MYBL2, SESN3, and CDC20. DEGs were screened using FDR-adjusted P < 0.05, FPKM ≥ 1, and |log2 fold change| ≥ 1. Data are presented as mean ± SD. aP < 0.05. DEGs: Differentially expressed genes; qRCR: Quantitative real-time polymerase chain reaction.
- Citation: Zhang RQ, Chu WH, Bai JB, Lei YH, Zhou D. Selenoprotein P attenuates oxidative senescence and ferroptosis-associated lipid peroxidation in dental pulp stem cells through a FOXM1-dependent program. World J Stem Cells 2026; 18(6): 119118
- URL: https://www.wjgnet.com/1948-0210/full/v18/i6/119118.htm
- DOI: https://dx.doi.org/10.4252/wjsc.119118