
















Copyright: ©Author(s) 2026.
World J Stem Cells. Jun 26, 2026; 18(6): 117622
Published online Jun 26, 2026. doi: 10.4252/wjsc.117622
Published online Jun 26, 2026. doi: 10.4252/wjsc.117622
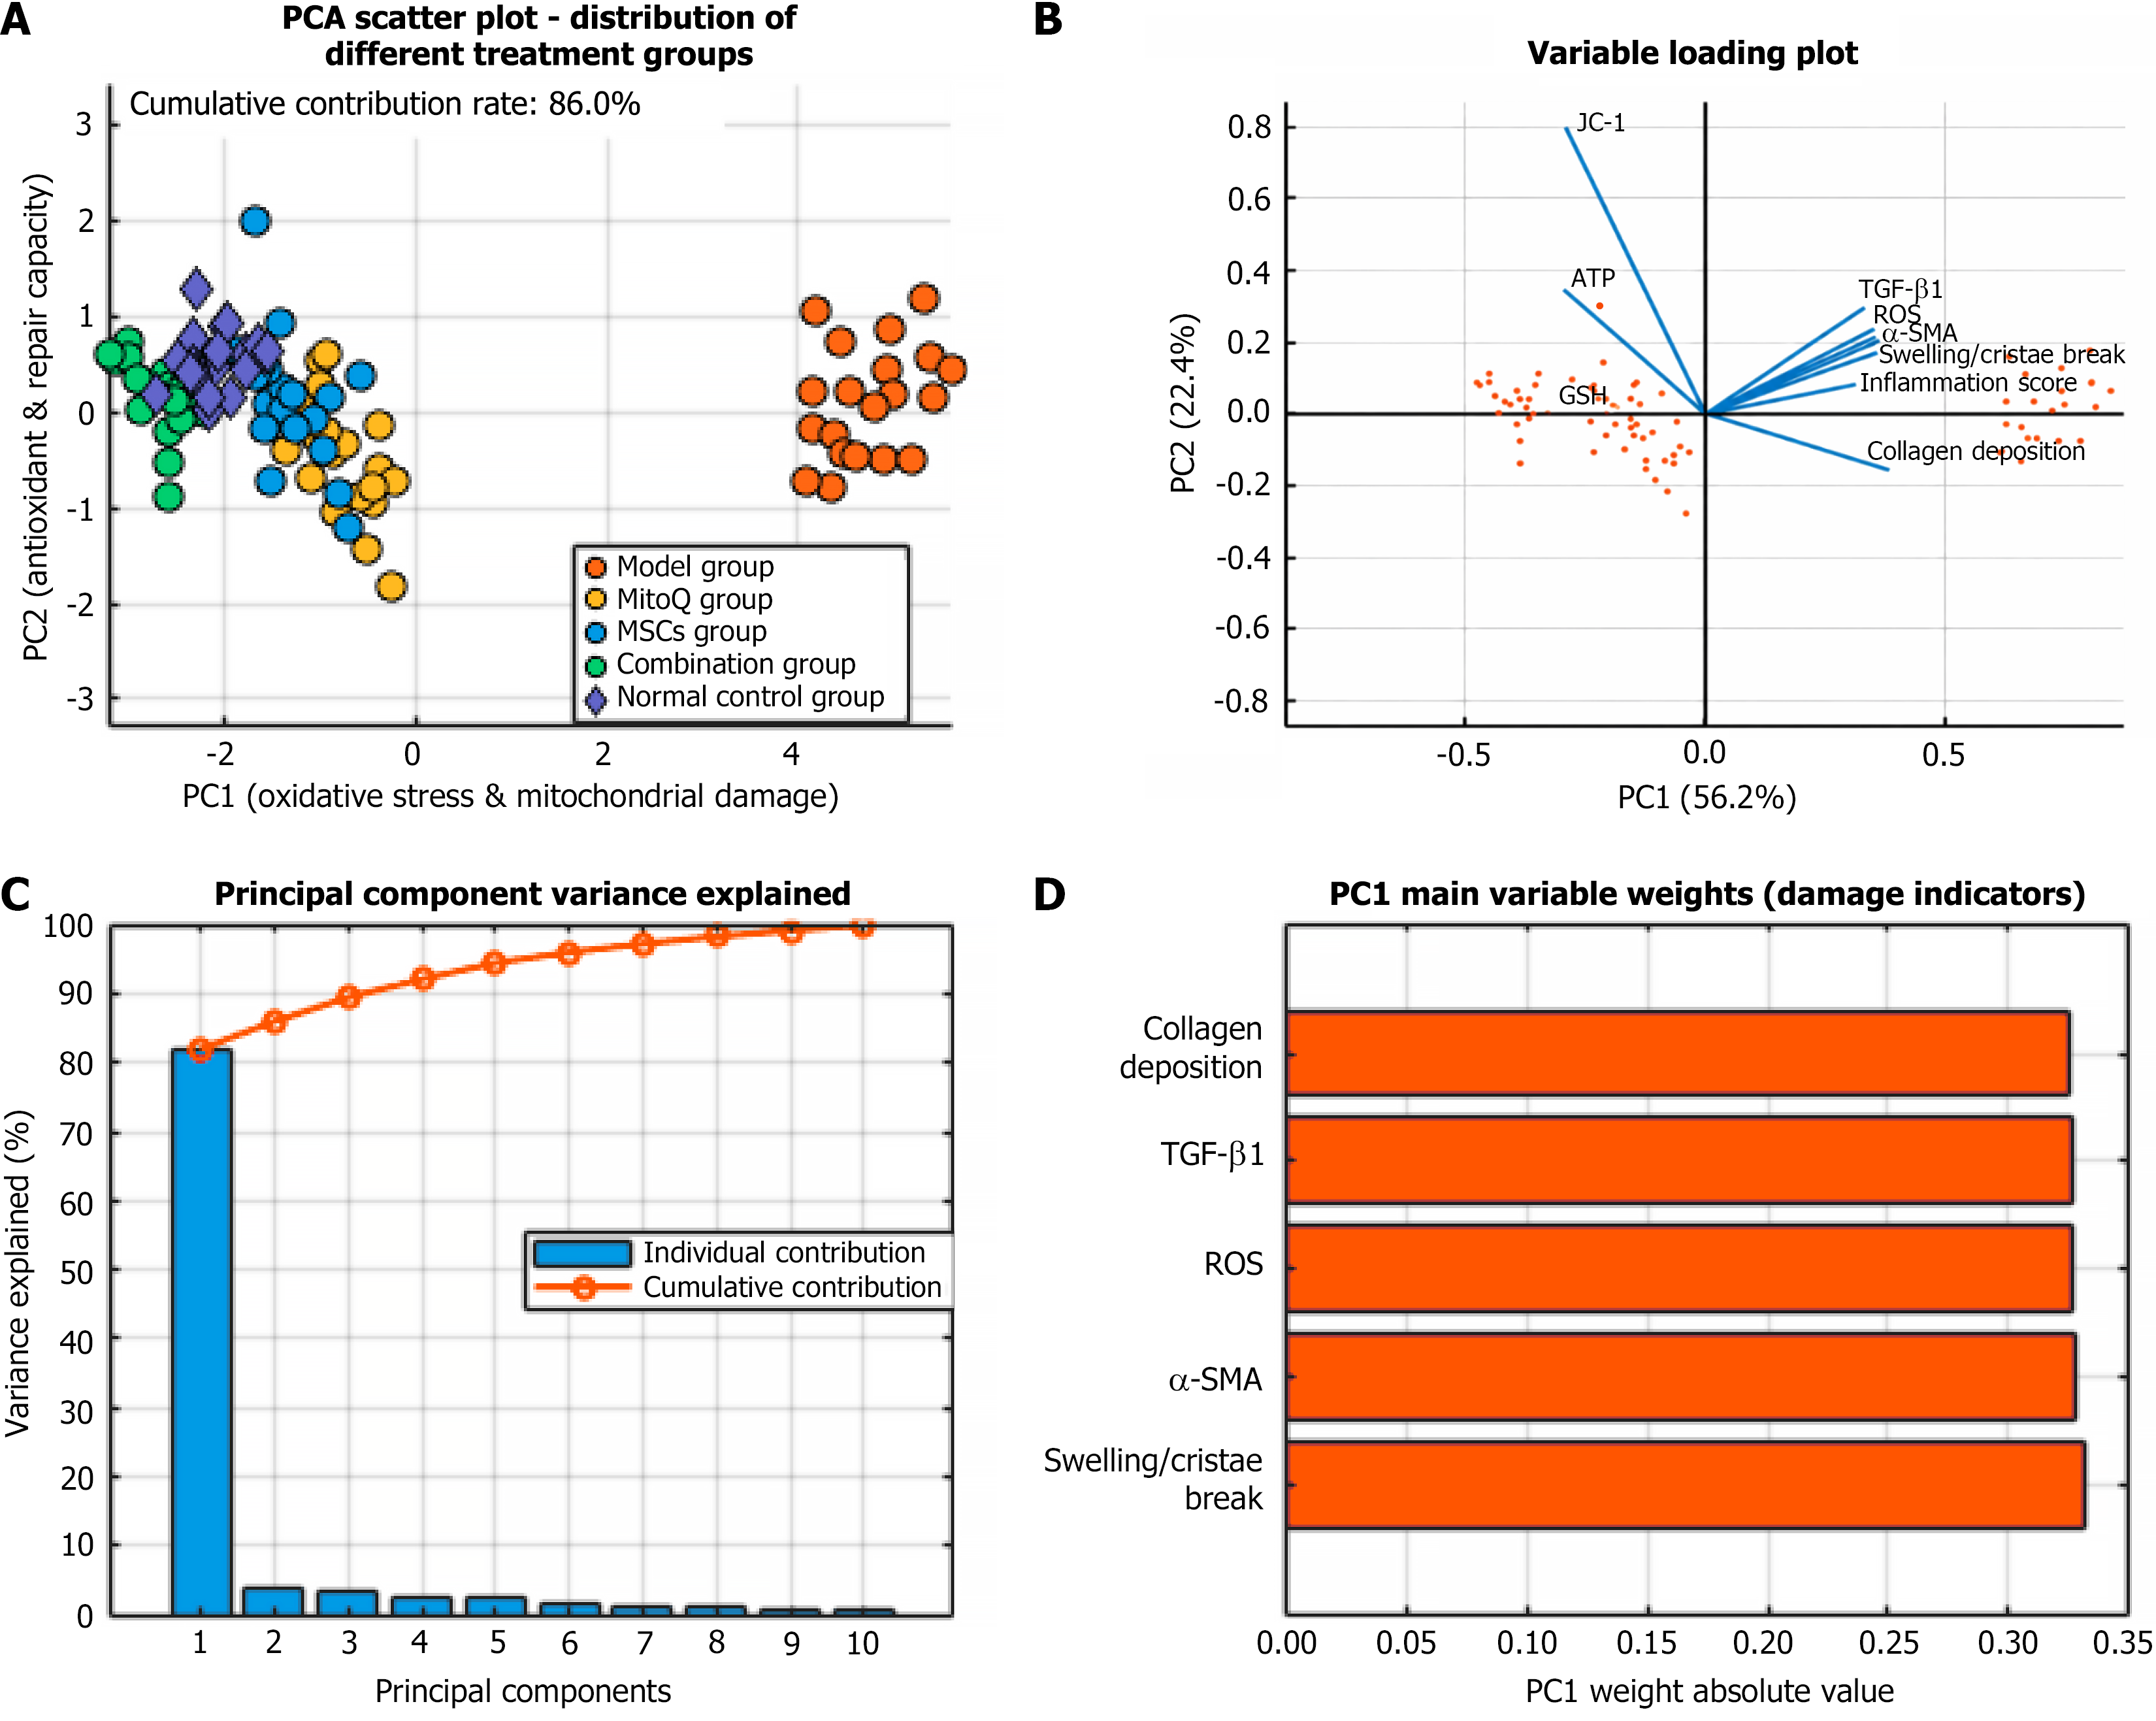
Figure 5 Principal component analysis results.
A: Principal component analysis score plot showing the distribution of the normal control, model, mitoquinone, mesenchymal stem cells, and combination groups; B: Principal component analysis loading plot showing the contributions of the measured variables to PC1 and PC2; C: Scree plot showing the individual and cumulative variance explained by each principal component; D: Bar plot showing the absolute weights of the main damage-related variables contributing to PC1. PC1 and PC2 explained 56.2% and 22.4% of the total variance, respectively, with a cumulative contribution rate of 86.0%. PCA: Principal component analysis.
- Citation: Hu YL, Lin ZX, Zhang XY, Li GL, Liu WJ, Shi ZQ, Li XH, Yang ZZ. Combining mitochondrial antioxidant mitoquinone and mesenchymal stem cell therapy for amelioration of radiation-induced lung injury: Synergistic regenerative strategy. World J Stem Cells 2026; 18(6): 117622
- URL: https://www.wjgnet.com/1948-0210/full/v18/i6/117622.htm
- DOI: https://dx.doi.org/10.4252/wjsc.117622