
















Copyright: ©Author(s) 2026.
World J Stem Cells. May 26, 2026; 18(5): 116280
Published online May 26, 2026. doi: 10.4252/wjsc.v18.i5.116280
Published online May 26, 2026. doi: 10.4252/wjsc.v18.i5.116280
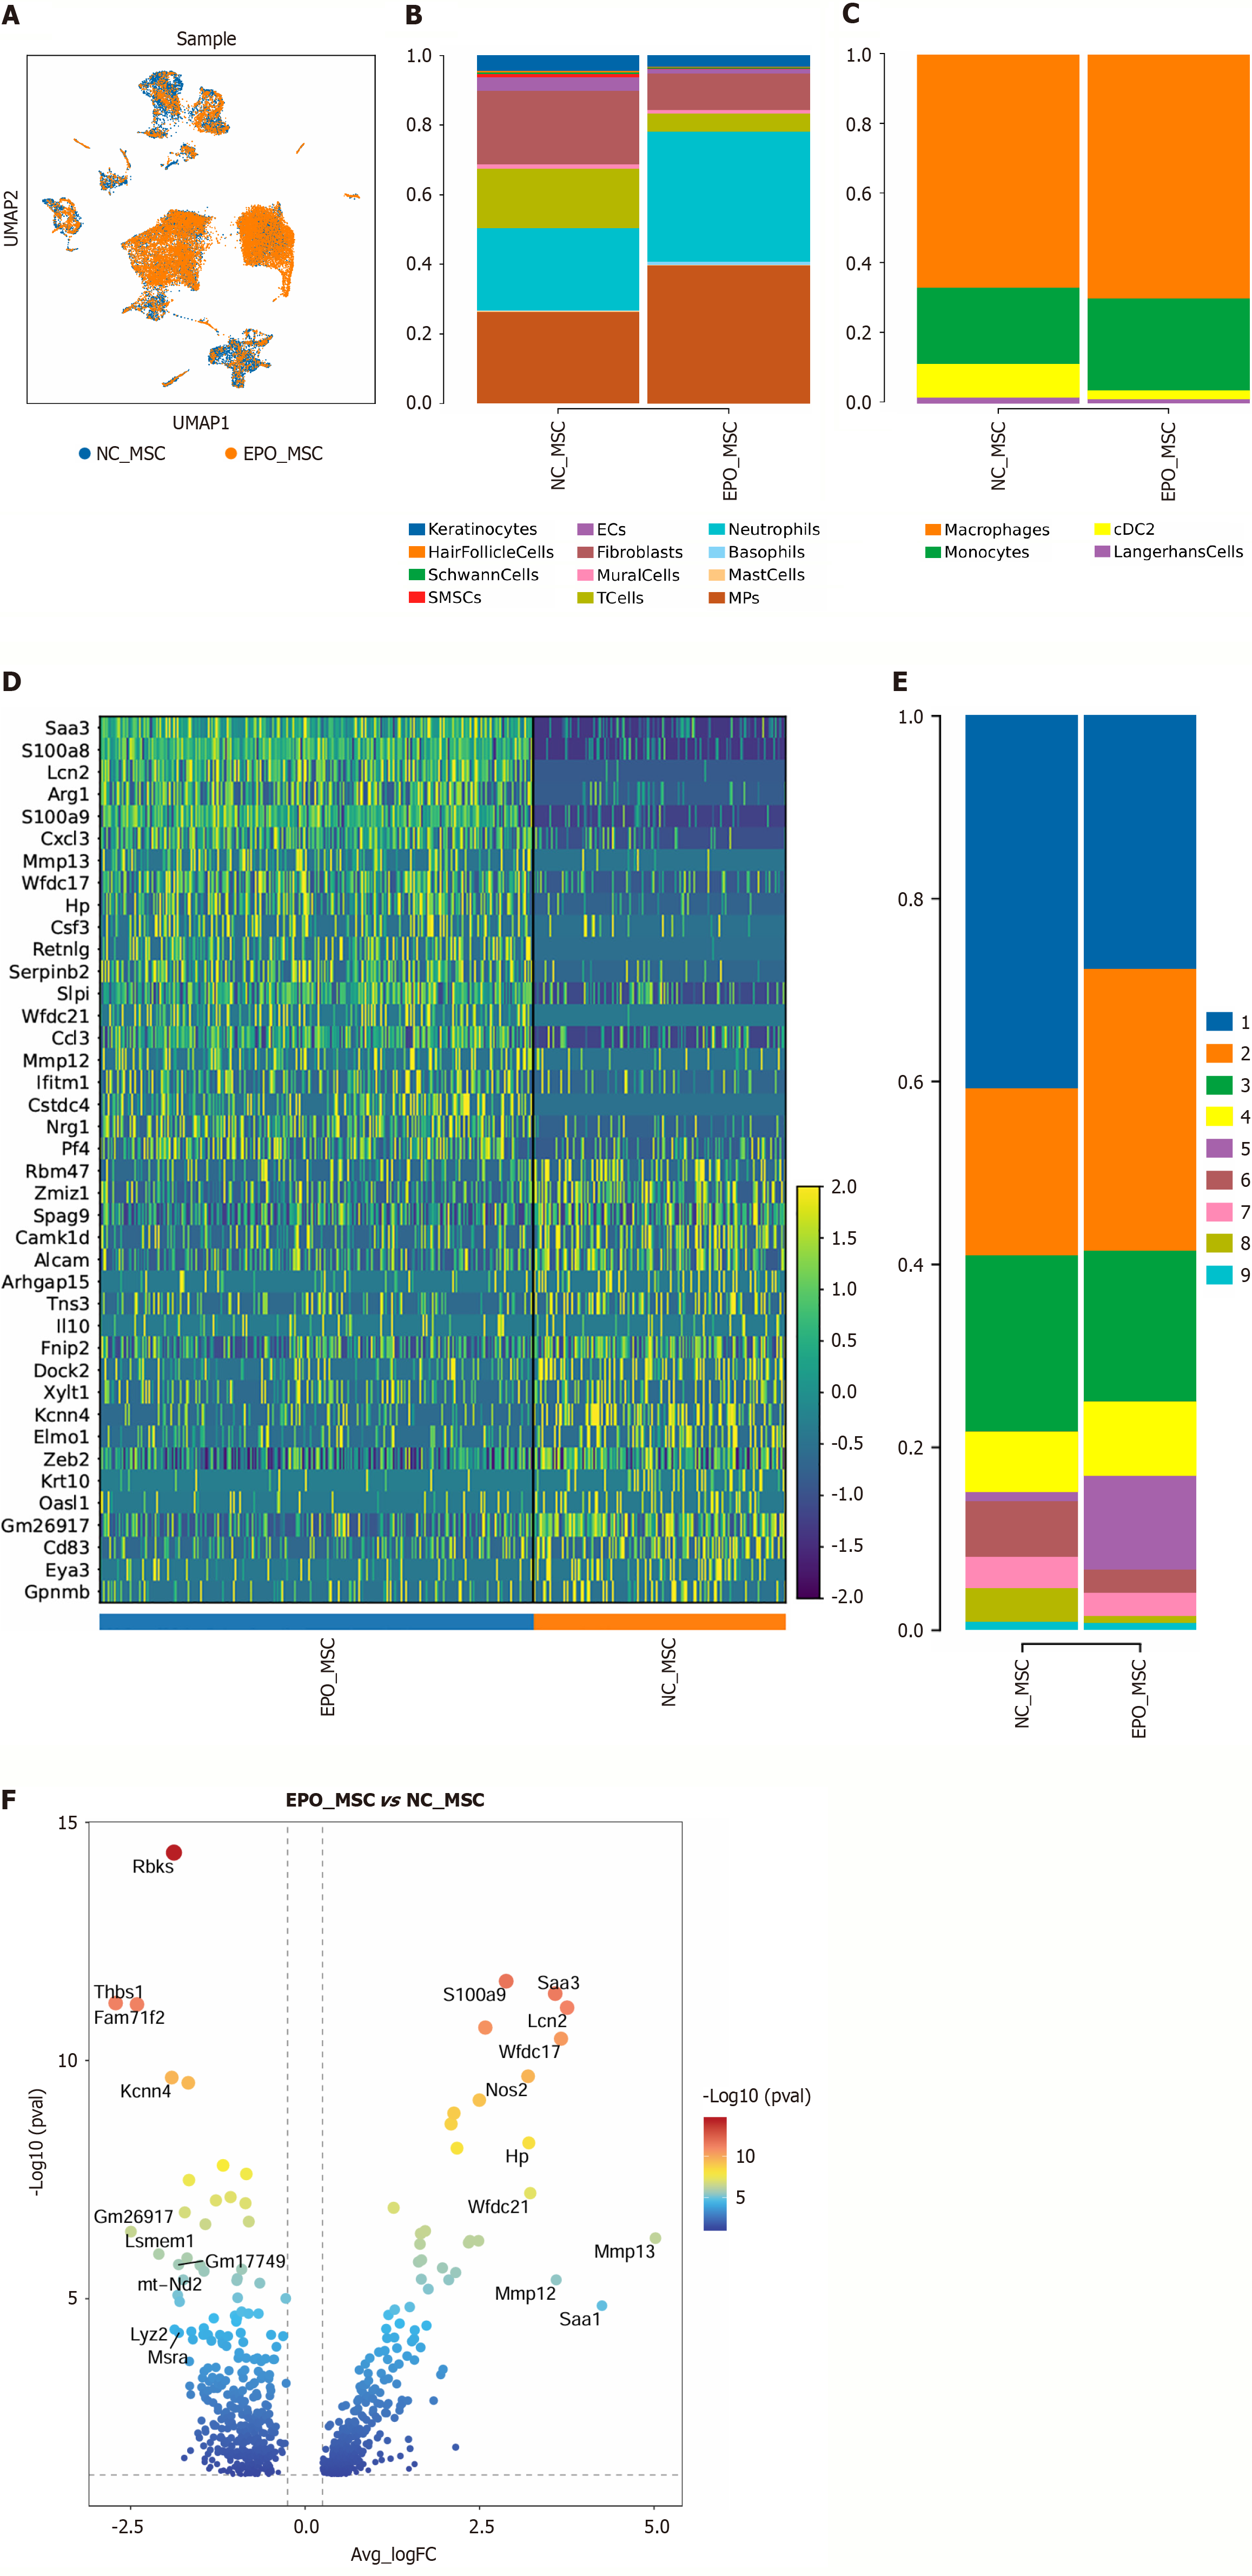
Figure 5 Single-cell RNA sequencing analysis of skin wound tissue from diabetic mice.
A: Uniform manifold approximation and projection clustering plot showing major cell populations identified by single-cell RNA sequencing in skin wound tissue from the diabetes mellitus, negative control mesenchymal stem cell, and erythropoietin-overexpressing mesenchymal stem cell groups; B: Proportional distribution of major cell populations in skin tissue; C: Proportional distribution of mononuclear phagocytes among the three groups; D: Heatmap illustrating differentially expressed genes in macrophage populations; E: Proportional distribution of macrophage subpopulations; F: Volcano plot showing differentially expressed genes in cluster 5 macrophages. NC-MSC: Negative control mesenchymal stem cell; EPO-MSC: Erythropoietin-overexpressing mesenchymal stem cell.
- Citation: Ma BD, Zhang SJ, Shao YM, Jin RR, Sun L, Lv PJ, Yue H, Hu SK, Ma XW. Erythropoietin-overexpressing mesenchymal stem cells accelerate diabetic wound healing via steroid signaling pathway modulation. World J Stem Cells 2026; 18(5): 116280
- URL: https://www.wjgnet.com/1948-0210/full/v18/i5/116280.htm
- DOI: https://dx.doi.org/10.4252/wjsc.v18.i5.116280