
















Copyright: ©Author(s) 2026.
World J Stem Cells. Apr 26, 2026; 18(4): 117652
Published online Apr 26, 2026. doi: 10.4252/wjsc.v18.i4.117652
Published online Apr 26, 2026. doi: 10.4252/wjsc.v18.i4.117652
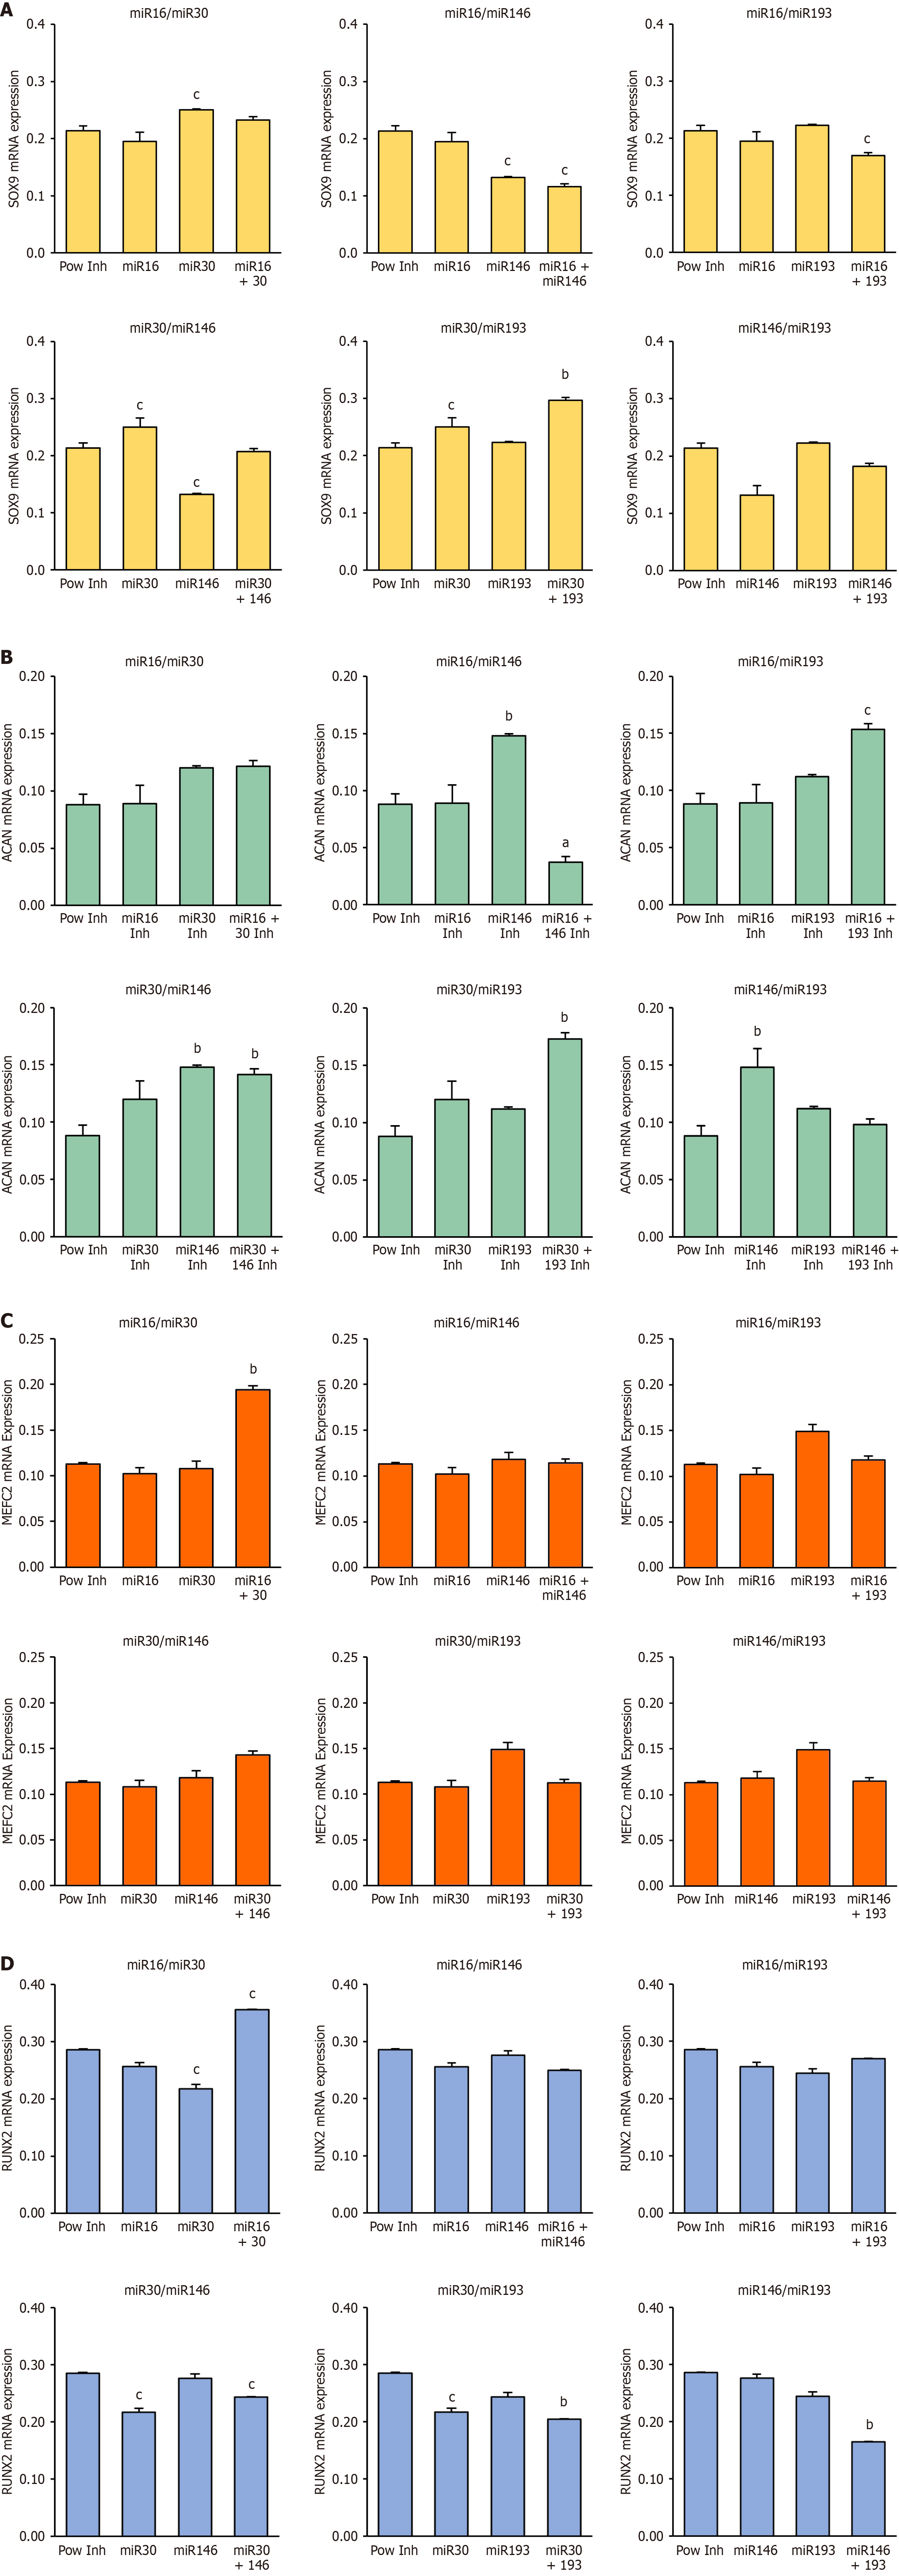
Figure 3 Gene expression in micromasses after transient anti-miR treatment.
A-D: Rat bone-marrow mesenchymal stem cells were transfected with single or combined locked nucleic acid-antisense oligonucleotides microRNA inhibitors, induced to form micromasses, and harvested on day 11 for quantitative real-time polymerase chain reaction. Sox9 (A) and Acan (B) (chondrogenic markers). Runx2 (C) and Mef2C (D) (hypertrophic markers). Expression was normalised to Gapdh and calculated as 2-ΔΔCt relative to the power inhibitor control. Bars show mean ± SEM (n = 3 independent experiments). Statistical comparisons vs power inhibitor by two-tailed Student’s t-test; aP < 0.05, bP < 0.01, cP < 0.005.
- Citation: Fontiveros-Palomino M, Álvarez-Iglesias I, González-González A, Alfonso-Fernández A, Pérez-Campo FM. Modulation of osteoarthritis-related microRNAs using locked nucleic acid-antisense oligonucleotides boosts chondrogenic lineage commitment of mesenchymal progenitors. World J Stem Cells 2026; 18(4): 117652
- URL: https://www.wjgnet.com/1948-0210/full/v18/i4/117652.htm
- DOI: https://dx.doi.org/10.4252/wjsc.v18.i4.117652