
















Copyright: ©Author(s) 2026.
World J Stem Cells. Apr 26, 2026; 18(4): 117652
Published online Apr 26, 2026. doi: 10.4252/wjsc.v18.i4.117652
Published online Apr 26, 2026. doi: 10.4252/wjsc.v18.i4.117652
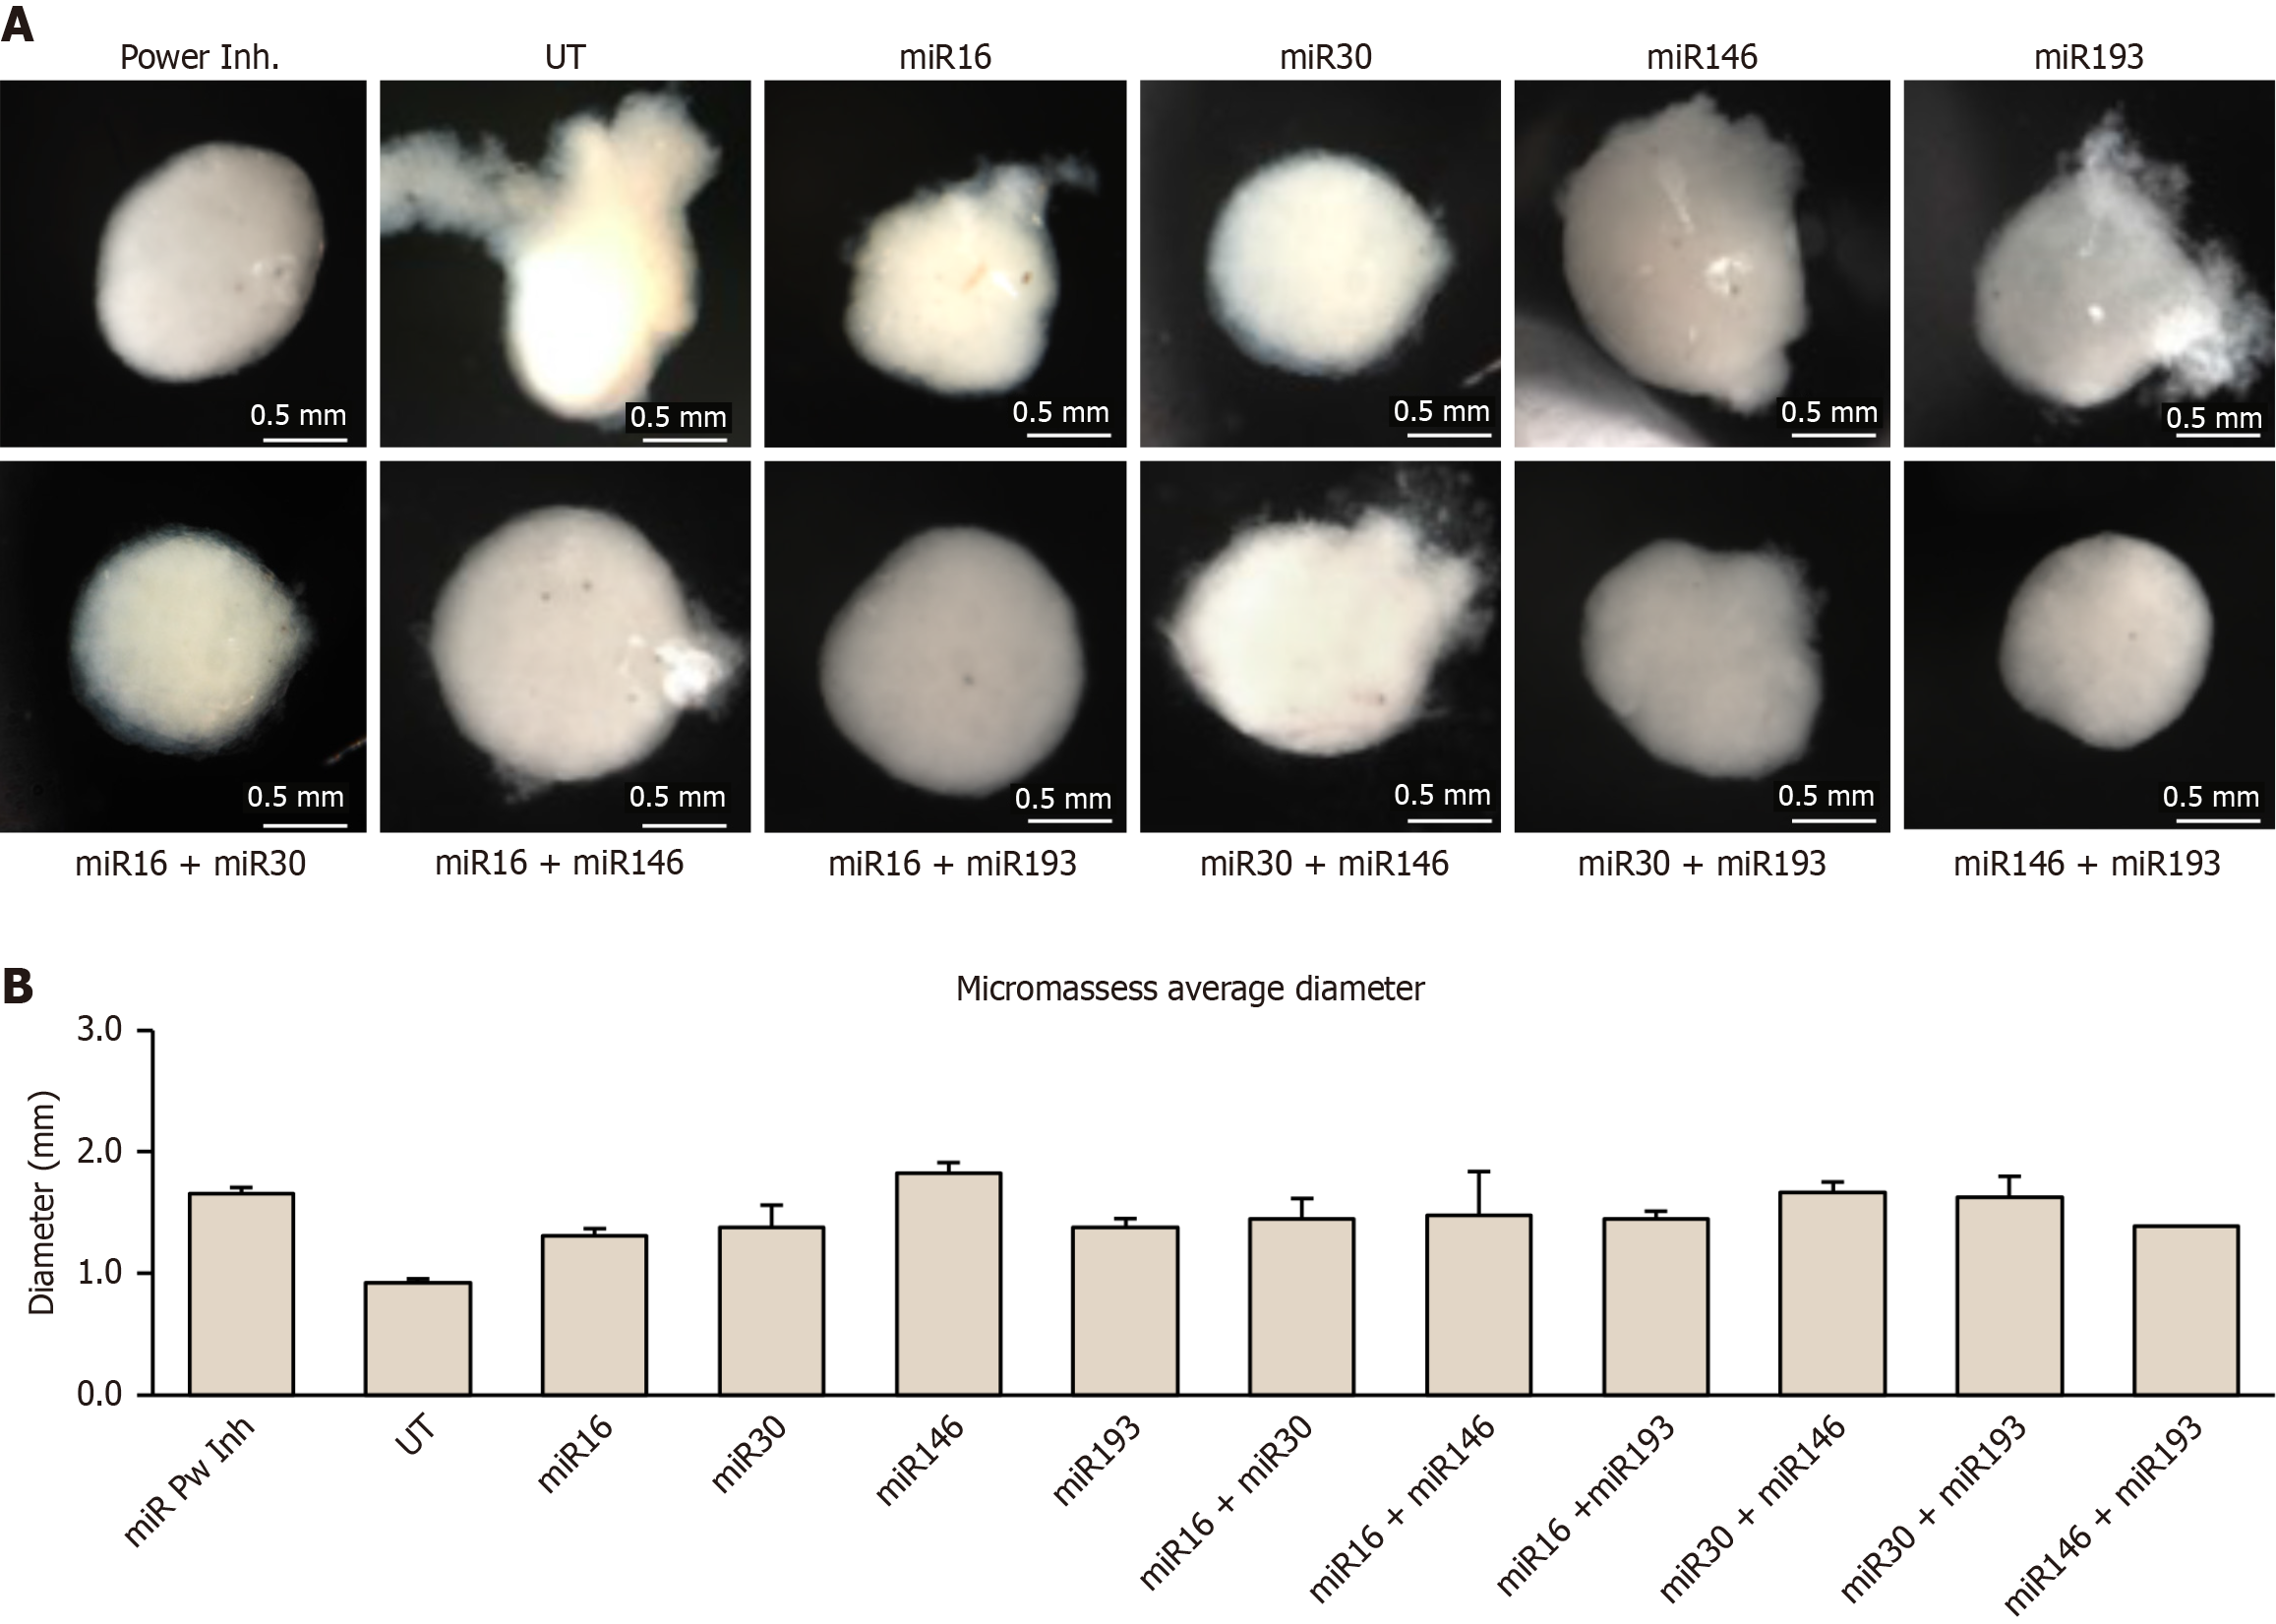
Figure 2 Macroscopic appearance and size of micromasses at day 21 of chondrogenic differentiation.
A: Representative stereomicroscope images (80 ×) of micromasses formed from control and locked nucleic acid-antisense oligonucleotides-transfected rat bone-marrow mesenchymal stem cells after 21 days in chondrogenic medium. Scale bar: 500 μm; B: Average micromass diameter for each condition. Diameters were measured in ImageJ along the longest axis on calibrated images. No obvious differences in diameter were detected across groups.
- Citation: Fontiveros-Palomino M, Álvarez-Iglesias I, González-González A, Alfonso-Fernández A, Pérez-Campo FM. Modulation of osteoarthritis-related microRNAs using locked nucleic acid-antisense oligonucleotides boosts chondrogenic lineage commitment of mesenchymal progenitors. World J Stem Cells 2026; 18(4): 117652
- URL: https://www.wjgnet.com/1948-0210/full/v18/i4/117652.htm
- DOI: https://dx.doi.org/10.4252/wjsc.v18.i4.117652