
















Copyright: ©Author(s) 2026.
World J Stem Cells. Apr 26, 2026; 18(4): 117652
Published online Apr 26, 2026. doi: 10.4252/wjsc.v18.i4.117652
Published online Apr 26, 2026. doi: 10.4252/wjsc.v18.i4.117652
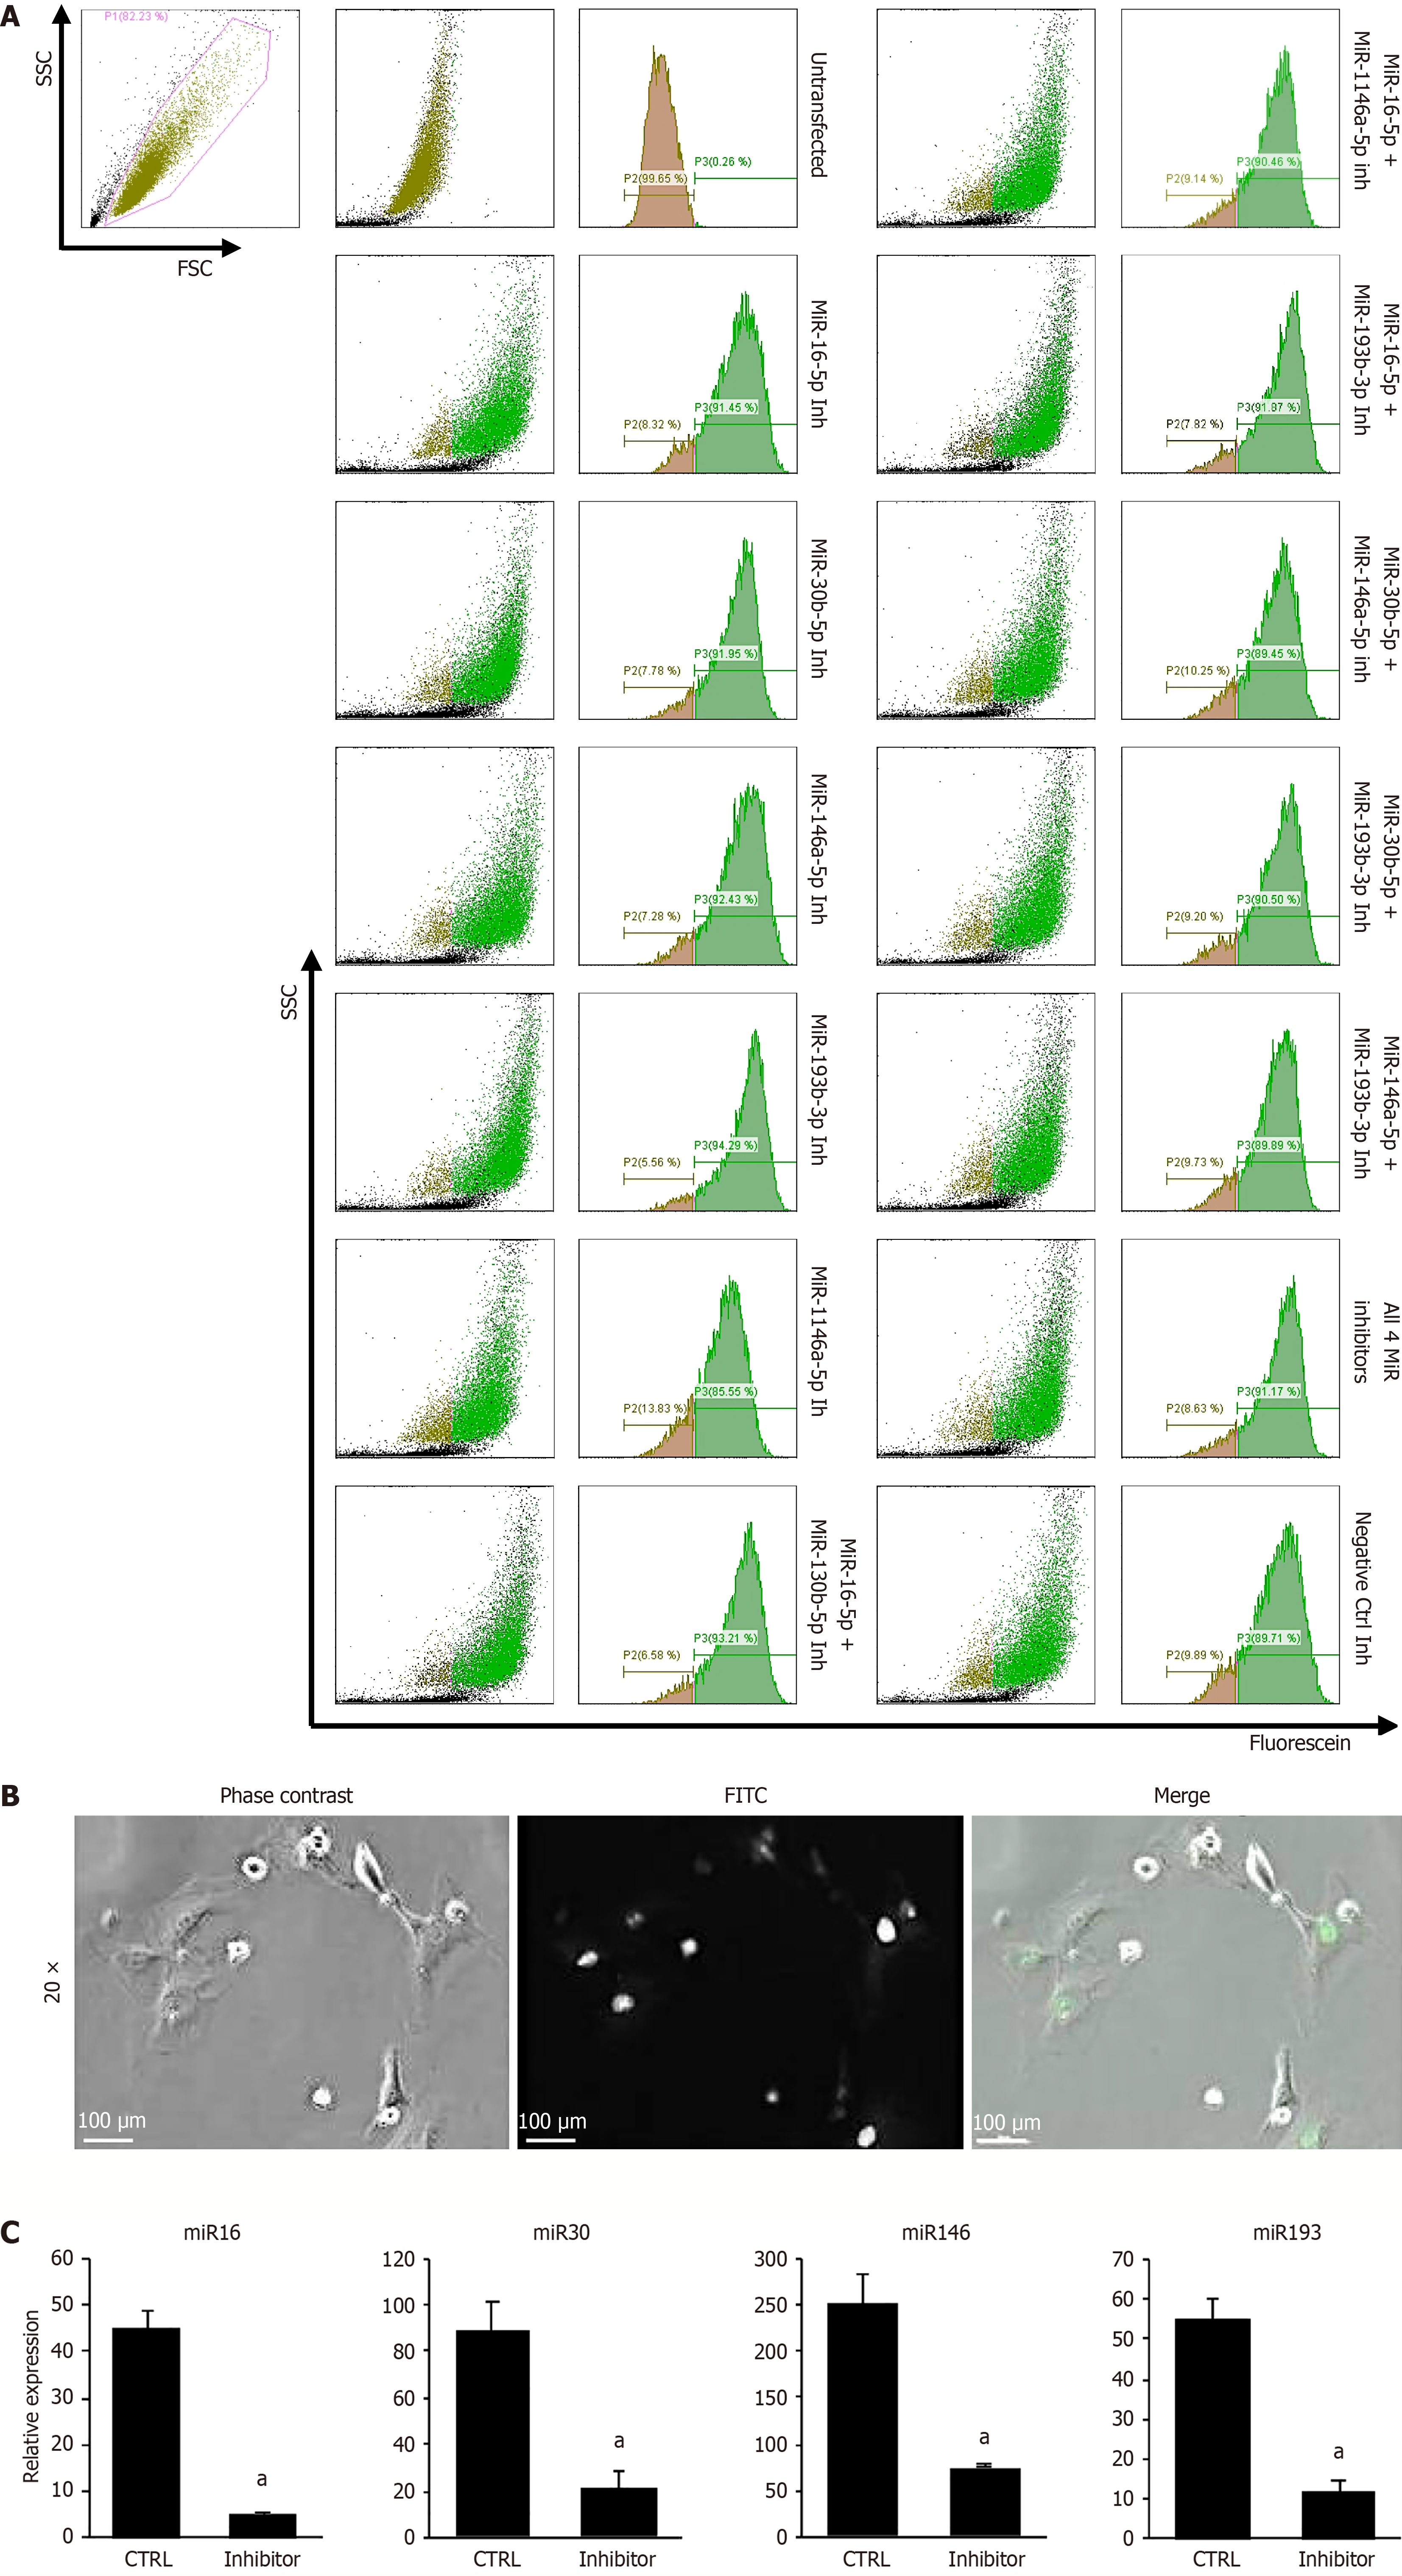
Figure 1 Lipid-assisted delivery of 3’-fluorescein-labelled locked nucleic acid-antisense oligonucleotide microRNA inhibitors into rat bone-marrow mesenchymal stem cells.
A: Representative flow-cytometry profiles of rat bone-marrow mesenchymal stem cells 48 hours after lipofection with locked nucleic acid-antisense oligonucleotide microRNA inhibitors, used either individually or in predefined combinations. Left panels show the FSC/SSC gating and example dot plots; right panels display the corresponding fluorescence histograms for the 3’-fluorescein (FAM) label. The green numbers indicate the percentage of FAM-positive cells for each transfection condition. Controls include non-transfected cells and cells transfected with a non-specific power inhibitor. Data illustrate high intracellular uptake across conditions; B: Phase-contrast and fluorescence micrographs of adherent rat bone-marrow mesenchymal stem cells 48 hours post-transfection (20 ×). Merged images showing predominantly nuclear signal with a minor cytoplasmic component, consistent with efficient intracellular trafficking of the labelled locked nucleic acid-antisense oligonucleotides; C: Relative expression of the indicated microRNAs measured by quantitative real-time polymerase chain reaction 48 hours after transfection. Data are normalised to U6 and expressed as 2-ΔΔCt relative to CTRL (power inhibitor). Bars represent mean (n = 3 independent experiments) and error bars = SEM. Statistical analysis: Two-tailed Student’s t-test vs CTRL; aP < 0.05, bP < 0.01, cP < 0.005.
- Citation: Fontiveros-Palomino M, Álvarez-Iglesias I, González-González A, Alfonso-Fernández A, Pérez-Campo FM. Modulation of osteoarthritis-related microRNAs using locked nucleic acid-antisense oligonucleotides boosts chondrogenic lineage commitment of mesenchymal progenitors. World J Stem Cells 2026; 18(4): 117652
- URL: https://www.wjgnet.com/1948-0210/full/v18/i4/117652.htm
- DOI: https://dx.doi.org/10.4252/wjsc.v18.i4.117652