
















Copyright: ©Author(s) 2026.
World J Stem Cells. Apr 26, 2026; 18(4): 115446
Published online Apr 26, 2026. doi: 10.4252/wjsc.v18.i4.115446
Published online Apr 26, 2026. doi: 10.4252/wjsc.v18.i4.115446
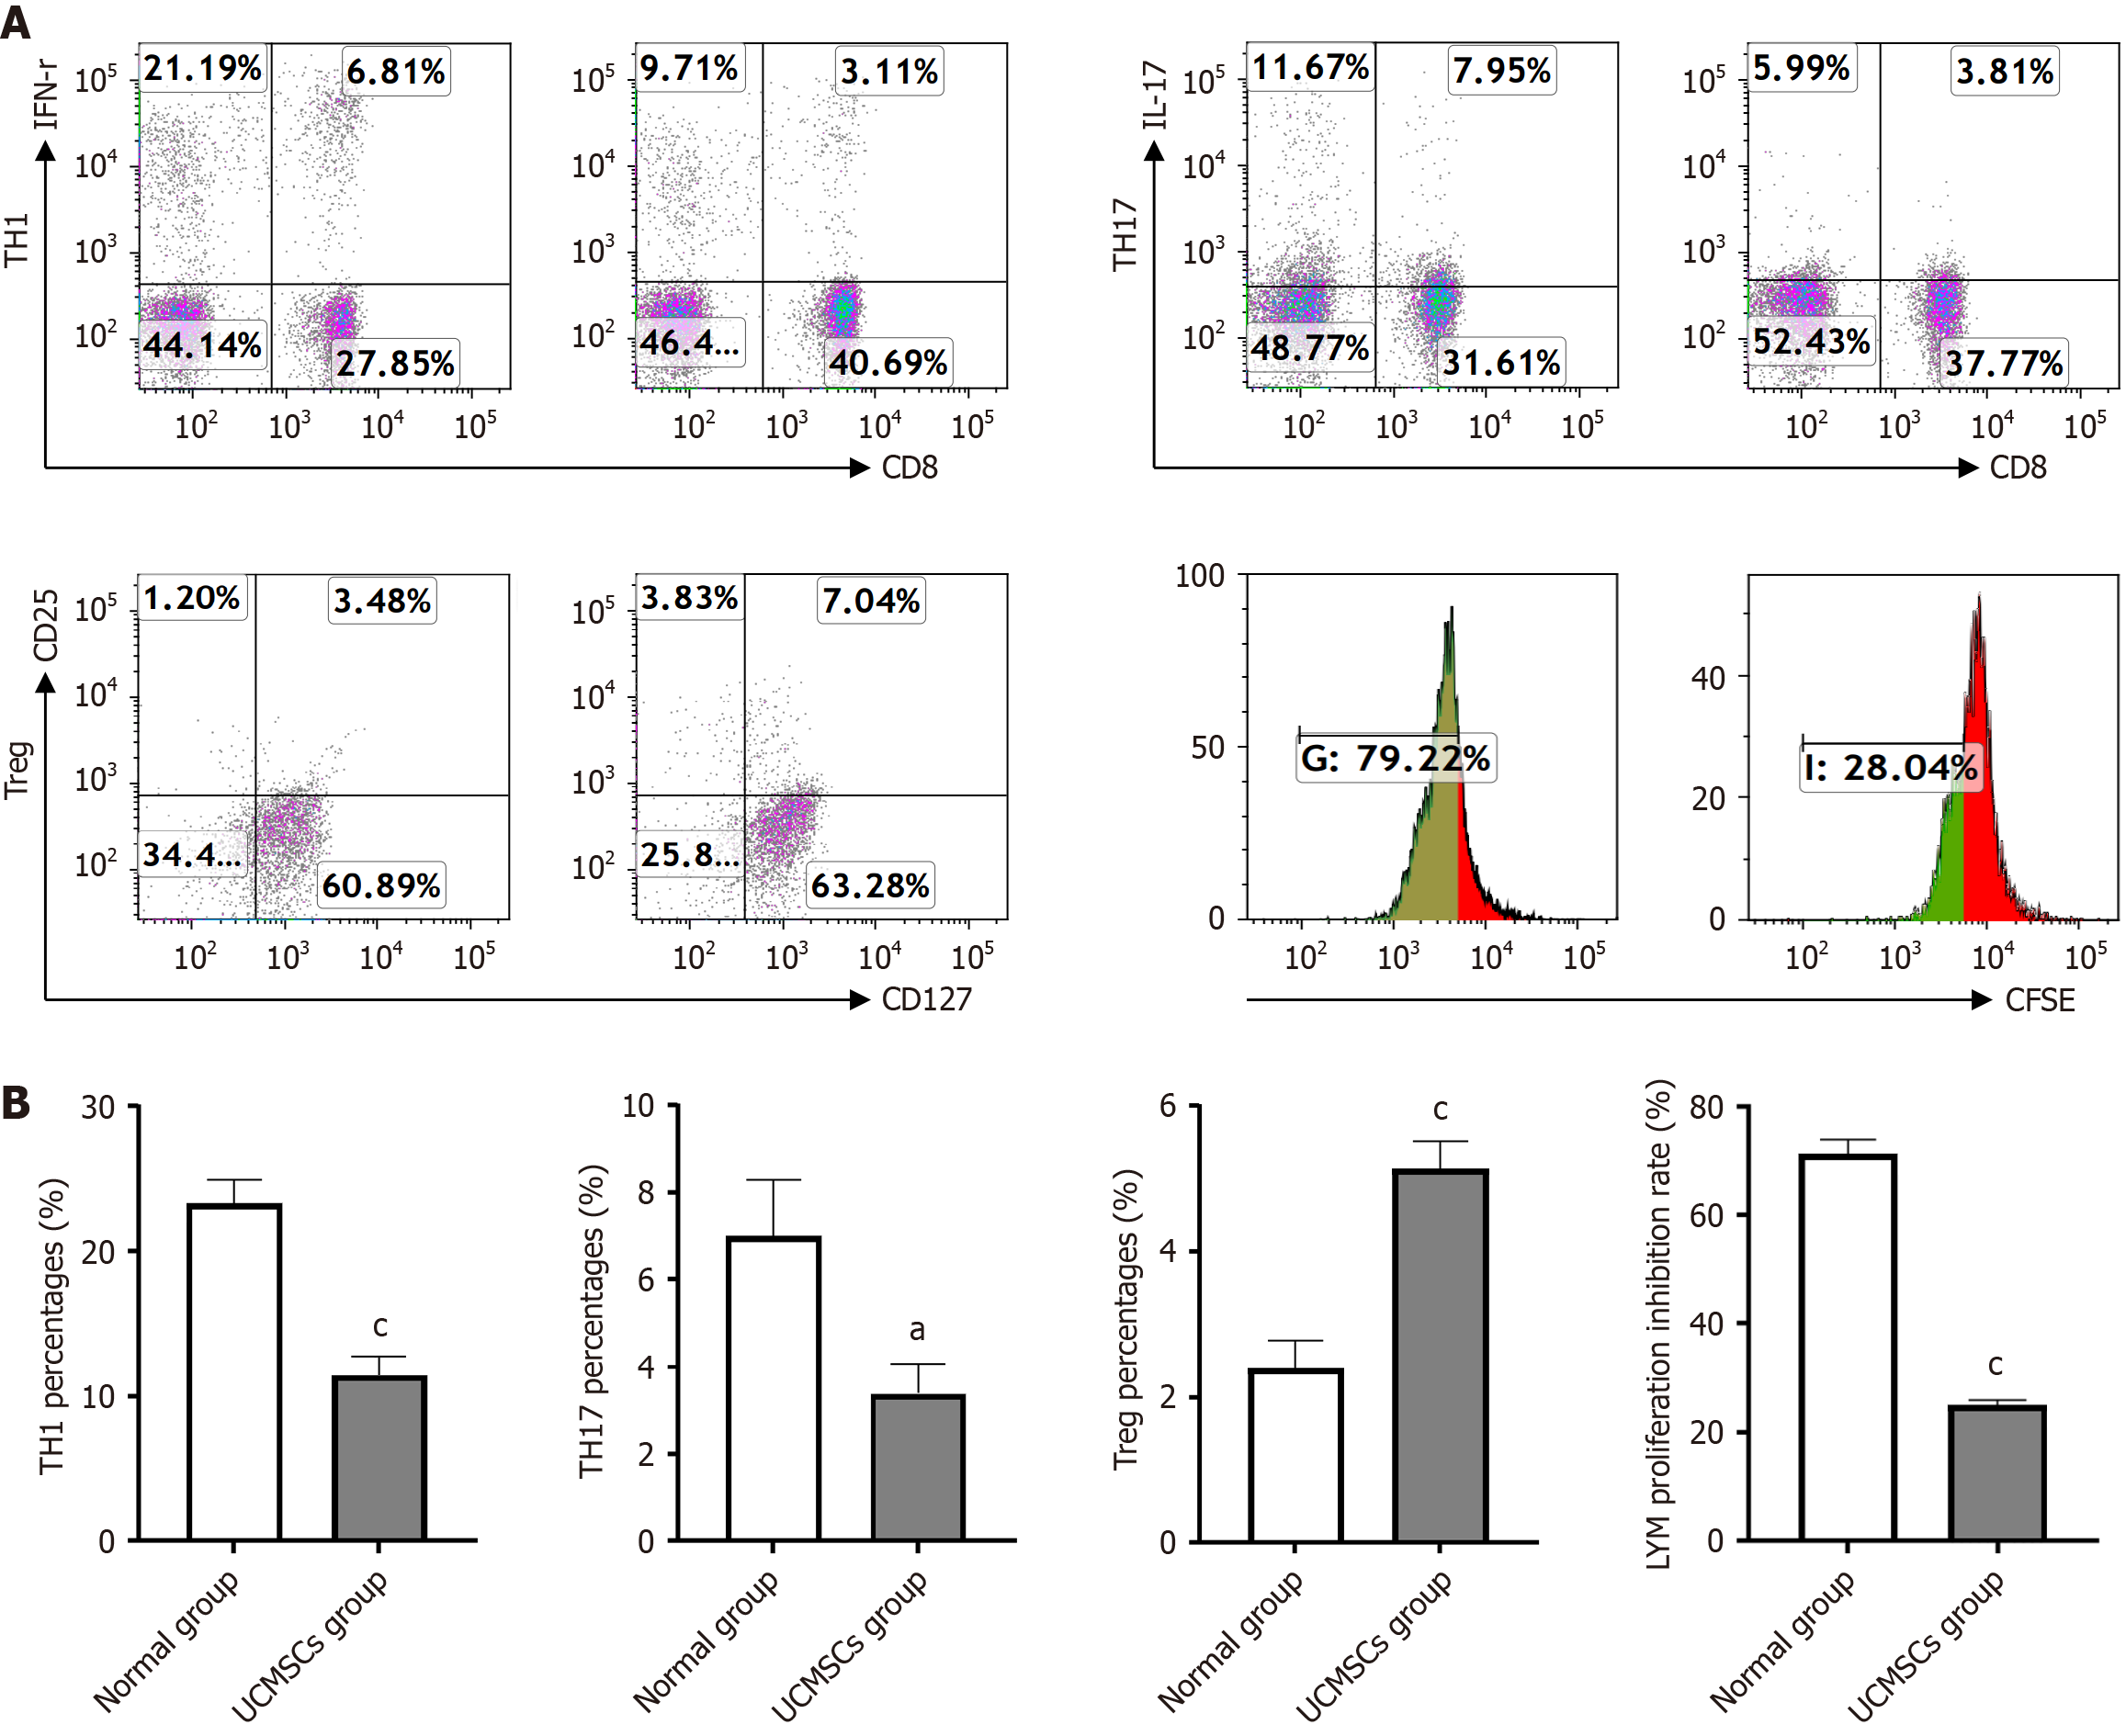
Figure 6 Changes in the percentages of immune cells after coculture of umbilical cord mesenchymal stem cells and peripheral blood mononuclear cells.
A: Flow cytometry was used to analyse the proliferation of Carboxy Fluorescein Succinimidyl Ester-labelled lymphocytes and changes in the percentages of T helper 1 (TH1), TH17, and regulatory T cells after coculture of umbilical cord mesenchymal stem cells and peripheral blood mononuclear cell; B: Quantitative analysis of the percentages of TH1 cells, TH17 cells and regulatory T after co-culture of umbilical cord mesenchymal stem cells and peripheral blood mononuclear cell. All data was expressed as mean ± SEM, aP < 0.05 vs lupus nephritis group, cP < 0.001 vs lupus nephritis group. TH1: T helper 1; Treg: Regulatory T; IFN: Interferon; IL: Interleukin; CFSE: Carboxy Fluorescein Succinimidyl Ester; UCMSCs: Umbilical cord mesenchymal stem cells.
- Citation: He LJ, Meng MY, Huang CK, Liu SY, Wang P, Long W, Gao H, Yang LS, He S, He Y, Guo YF, Zhao YY, Liu Y, Hu LR, Li L, Hou ZL, Wang WJ, Wang XD. Mesenchymal stem cells alleviate renal injury of lupus nephritis mice by reconstructing the immune microenvironment of renal tissue. World J Stem Cells 2026; 18(4): 115446
- URL: https://www.wjgnet.com/1948-0210/full/v18/i4/115446.htm
- DOI: https://dx.doi.org/10.4252/wjsc.v18.i4.115446