
















Copyright: ©Author(s) 2026.
World J Stem Cells. Apr 26, 2026; 18(4): 115446
Published online Apr 26, 2026. doi: 10.4252/wjsc.v18.i4.115446
Published online Apr 26, 2026. doi: 10.4252/wjsc.v18.i4.115446
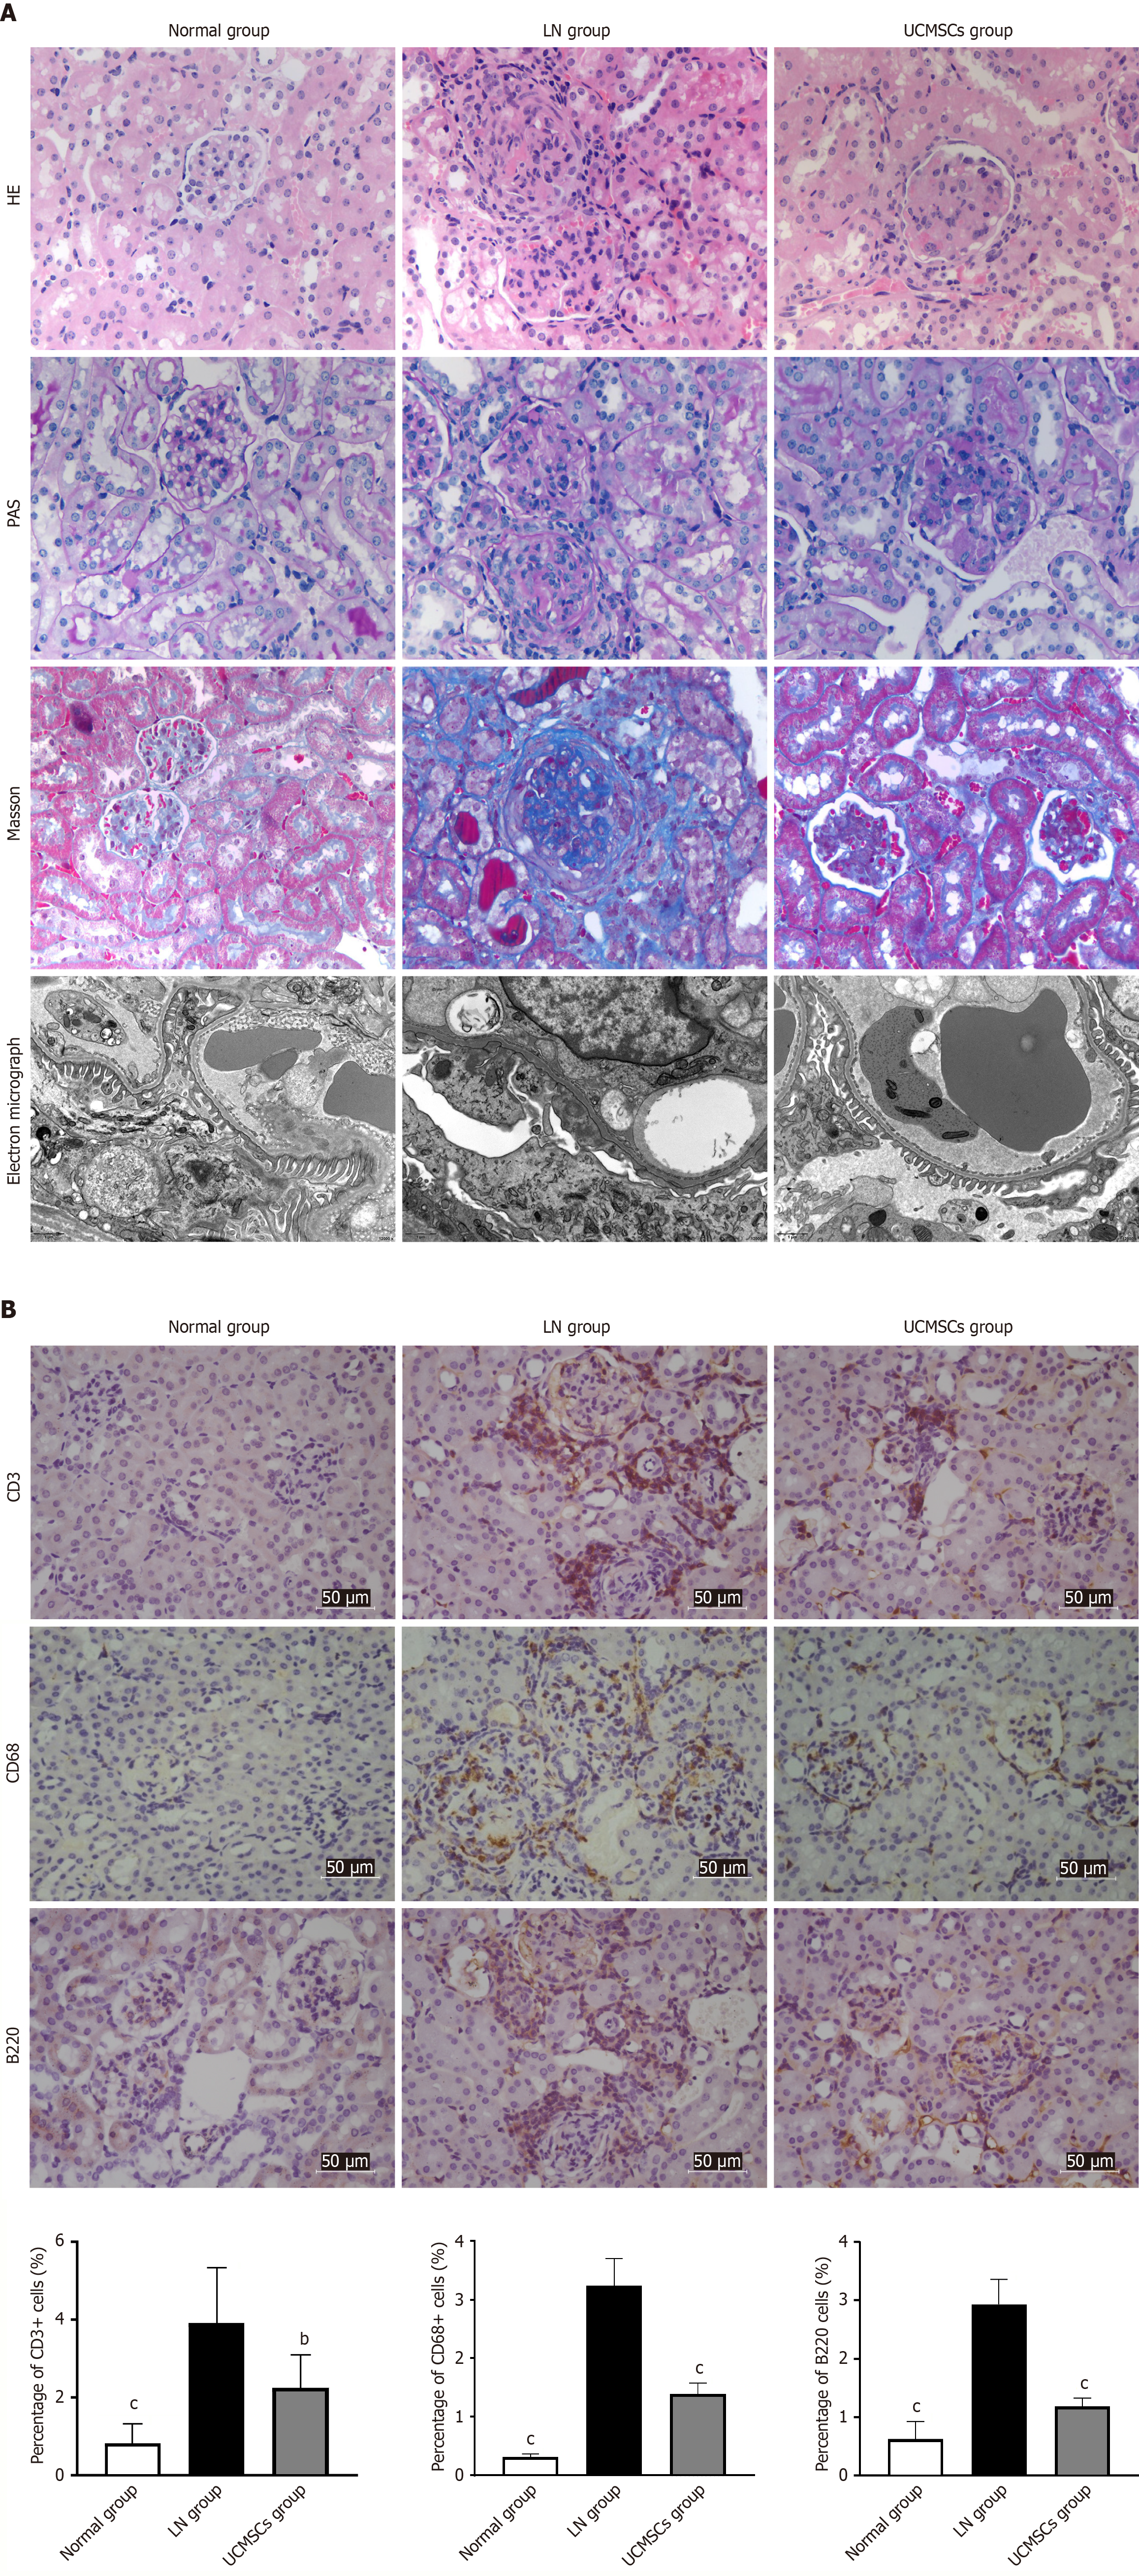
Figure 3 Results of renal tissue pathology and electron microscopy.
A: Pathological and electron microscopy results of renal tissue. Hematoxylin and eosin staining (1st line, 400 ×), periodic acid-Schiff staining (2nd line, 400 ×), Masson’s trichrome staining (3rd line, 400 ×) and electron microscopy (4th line, 12000 ×). Normal group (1st column), lupus nephritis group (2nd column), and umbilical cord mesenchymal stem cells group (3rd column) were used; B: Immunohistochemical staining and statistical results of CD3, CD68 and B220 in mice kidney tissue. All data was expressed as mean ± SEM, bP < 0.01 vs lupus nephritis group, cP < 0.001 vs lupus nephritis group. LN: Lupus nephritis; UCMSCs: Umbilical cord mesenchymal stem cells; HE: Hematoxylin and eosin; PAS: Periodic acid-Schiff.
- Citation: He LJ, Meng MY, Huang CK, Liu SY, Wang P, Long W, Gao H, Yang LS, He S, He Y, Guo YF, Zhao YY, Liu Y, Hu LR, Li L, Hou ZL, Wang WJ, Wang XD. Mesenchymal stem cells alleviate renal injury of lupus nephritis mice by reconstructing the immune microenvironment of renal tissue. World J Stem Cells 2026; 18(4): 115446
- URL: https://www.wjgnet.com/1948-0210/full/v18/i4/115446.htm
- DOI: https://dx.doi.org/10.4252/wjsc.v18.i4.115446