
















©Author(s) (or their employer(s)) 2026.
World J Stem Cells. Feb 26, 2026; 18(2): 112940
Published online Feb 26, 2026. doi: 10.4252/wjsc.v18.i2.112940
Published online Feb 26, 2026. doi: 10.4252/wjsc.v18.i2.112940
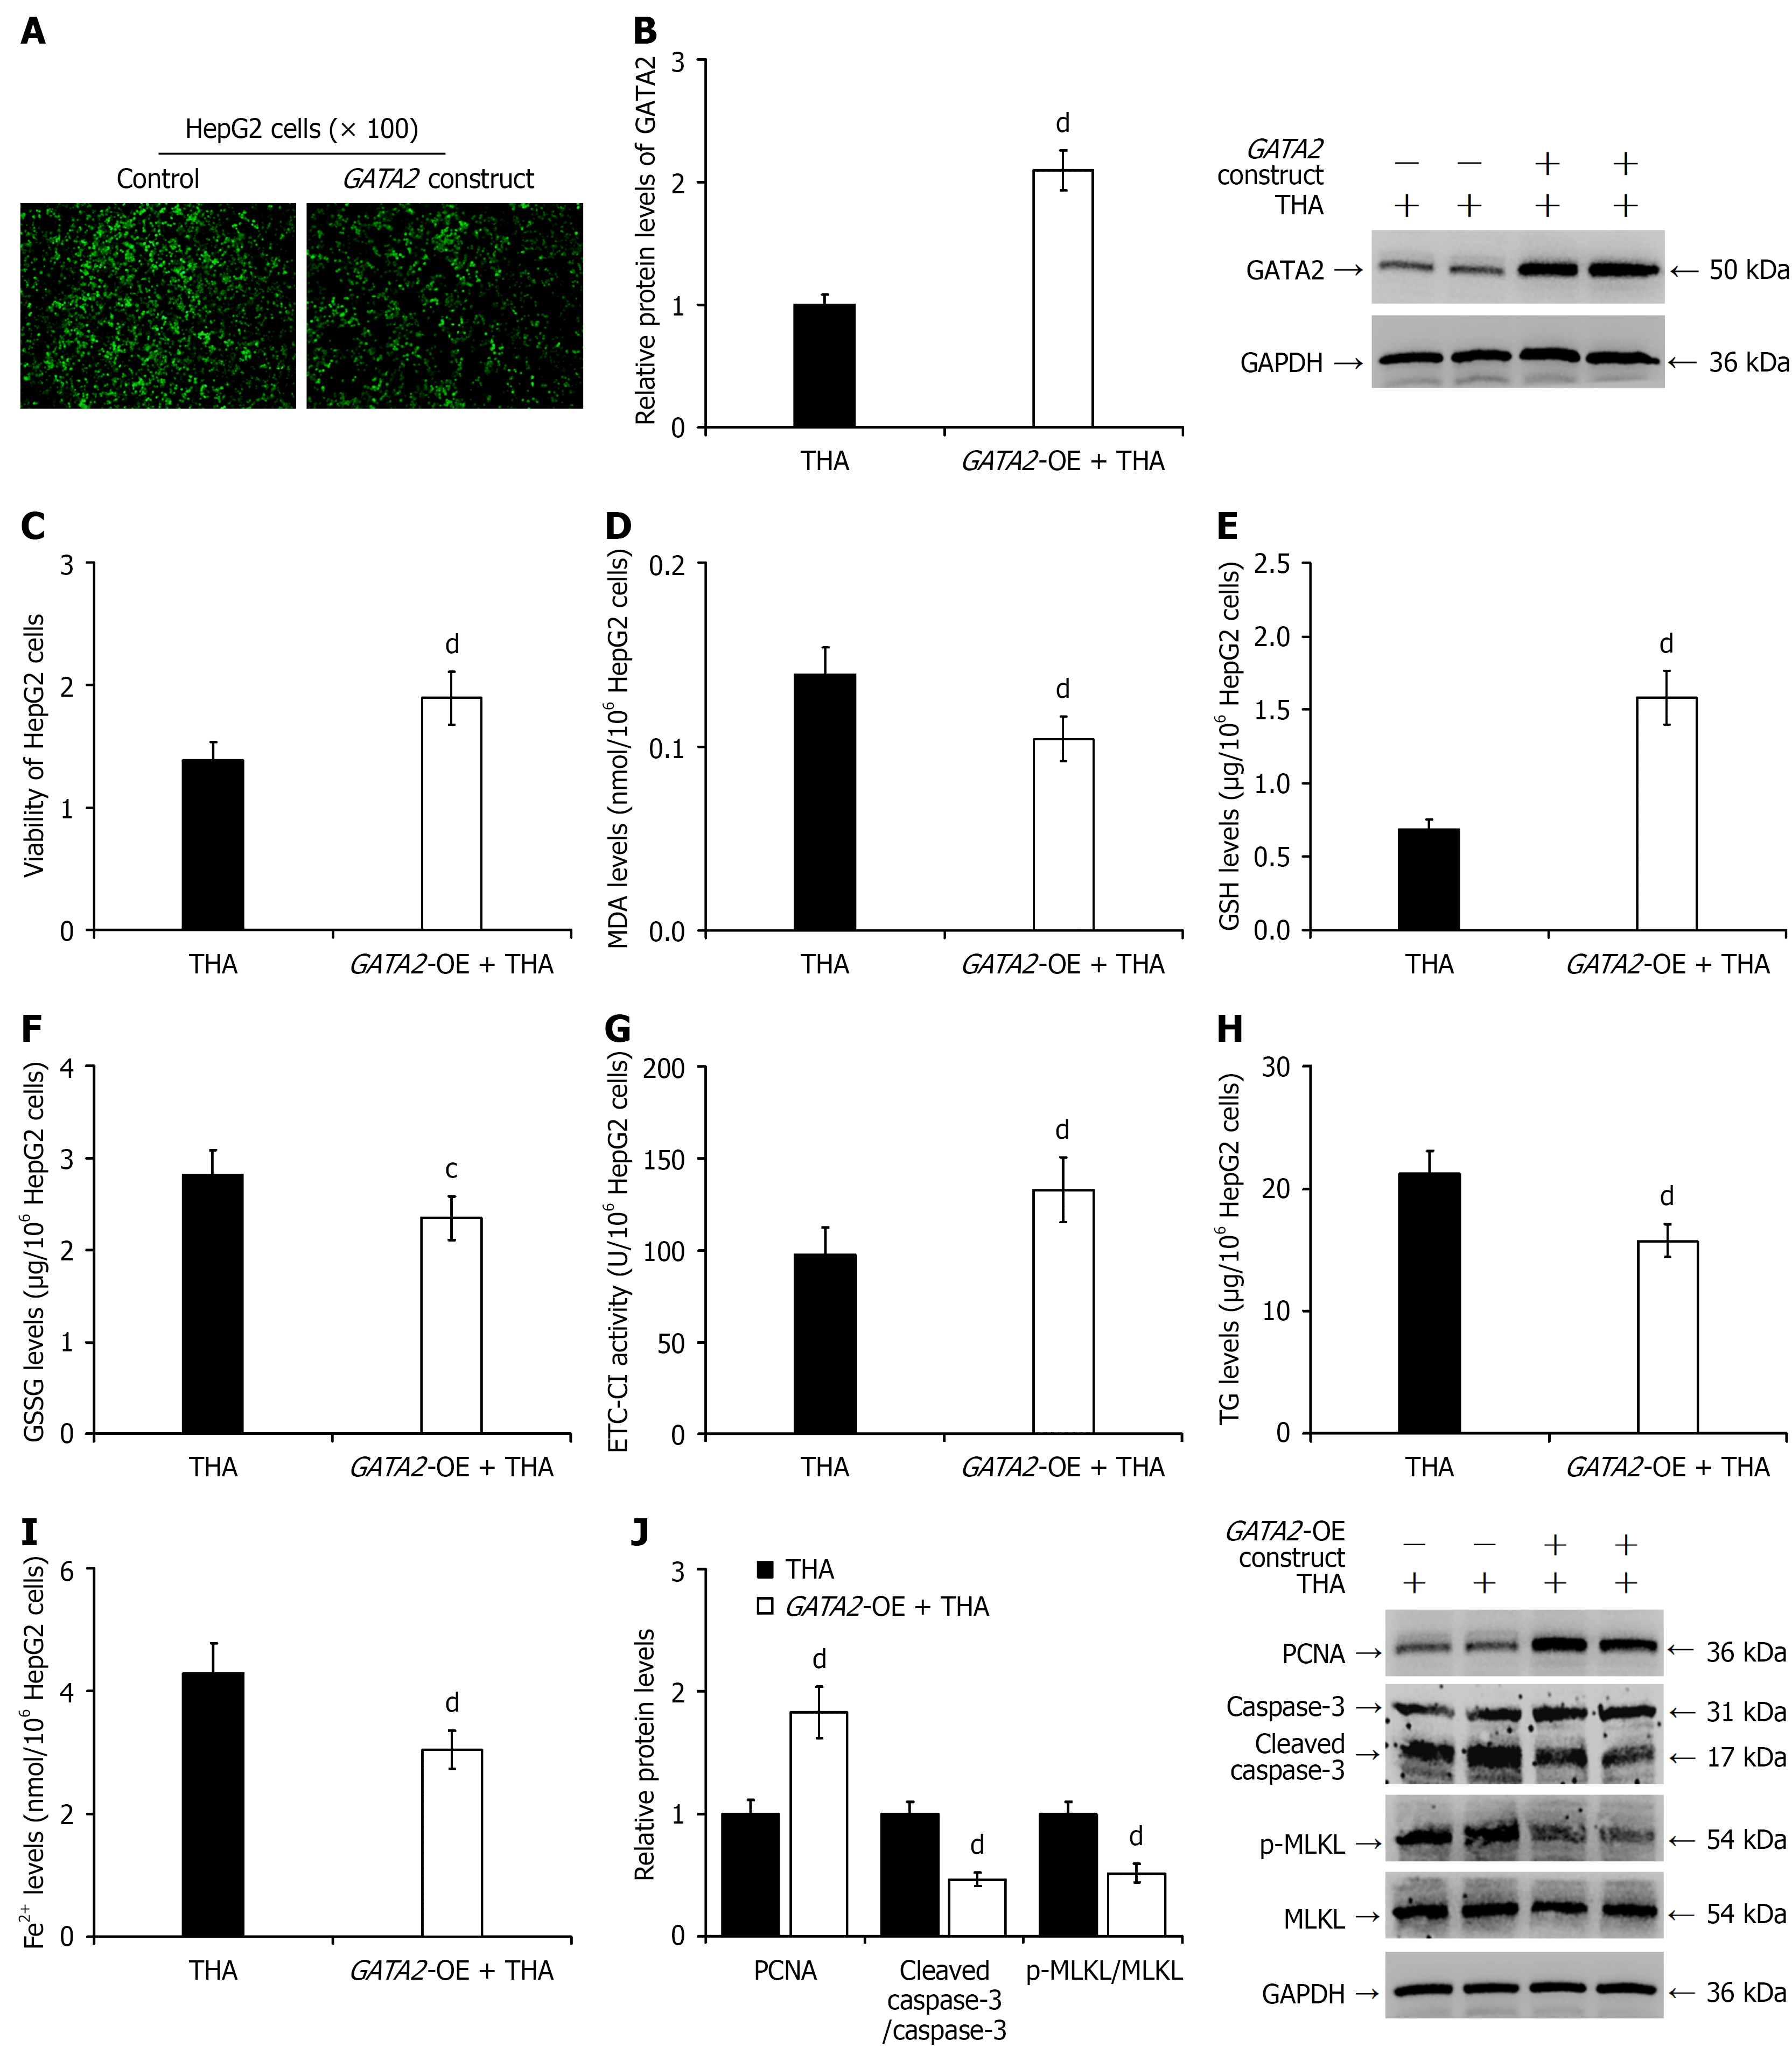
Figure 7 GATA2 overexpression protected HepG2 cells from endoplasmic reticulum stress-induced injury.
A: Fluorescence microscopy images confirming transfection efficiency; B: Western blot analysis of GATA2 protein expression, with representative blots displayed alongside quantitative results; C: Assessment of cell viability using the Cell Counting Kit-8 assay; D: Intracellular malondialdehyde content; E: Glutathione levels; F: Oxidized glutathione levels; G: Electron transfer chain complex I activity; H: Triglyceride levels; I: Ferrous ion levels; J: Western blot analysis of proliferating cell nuclear antigen, cleaved caspase-3, and phosphorylated mixed lineage kinase domain-like protein expression (representative blots shown) with quantification. cP < 0.05 vs the thapsigargin group; dP < 0.01 vs the thapsigargin group. THA: Thapsigargin; MDA: Malondialdehyde; GSH: Glutathione; GSSG: Oxidized glutathione; ETC-CI: Electron transfer chain complex I; TG: Triglyceride; p-MLKL: Phosphorylated mixed lineage kinase domain-like protein; MLKL: Mixed lineage kinase domain-like protein.
- Citation: Chen YF, Li SQ, Zhang J, Ma WT, Zhou Y, Rao JX, Yi Y, Cheng QJ, Zhong WW, Chen H, Chen YH, Luo YW, He YH. GATA2 deficiency exacerbates chronic liver injury via disrupting hepatocyte death-regeneration balance: Clinical, histopathological, and molecular evidence. World J Stem Cells 2026; 18(2): 112940
- URL: https://www.wjgnet.com/1948-0210/full/v18/i2/112940.htm
- DOI: https://dx.doi.org/10.4252/wjsc.v18.i2.112940