
















Copyright: ©Author(s) 2026.
World J Stem Cells. Oct 26, 2026; 18(10): 125423
Published online Oct 26, 2026. doi: 10.4252/wjsc.125423
Published online Oct 26, 2026. doi: 10.4252/wjsc.125423
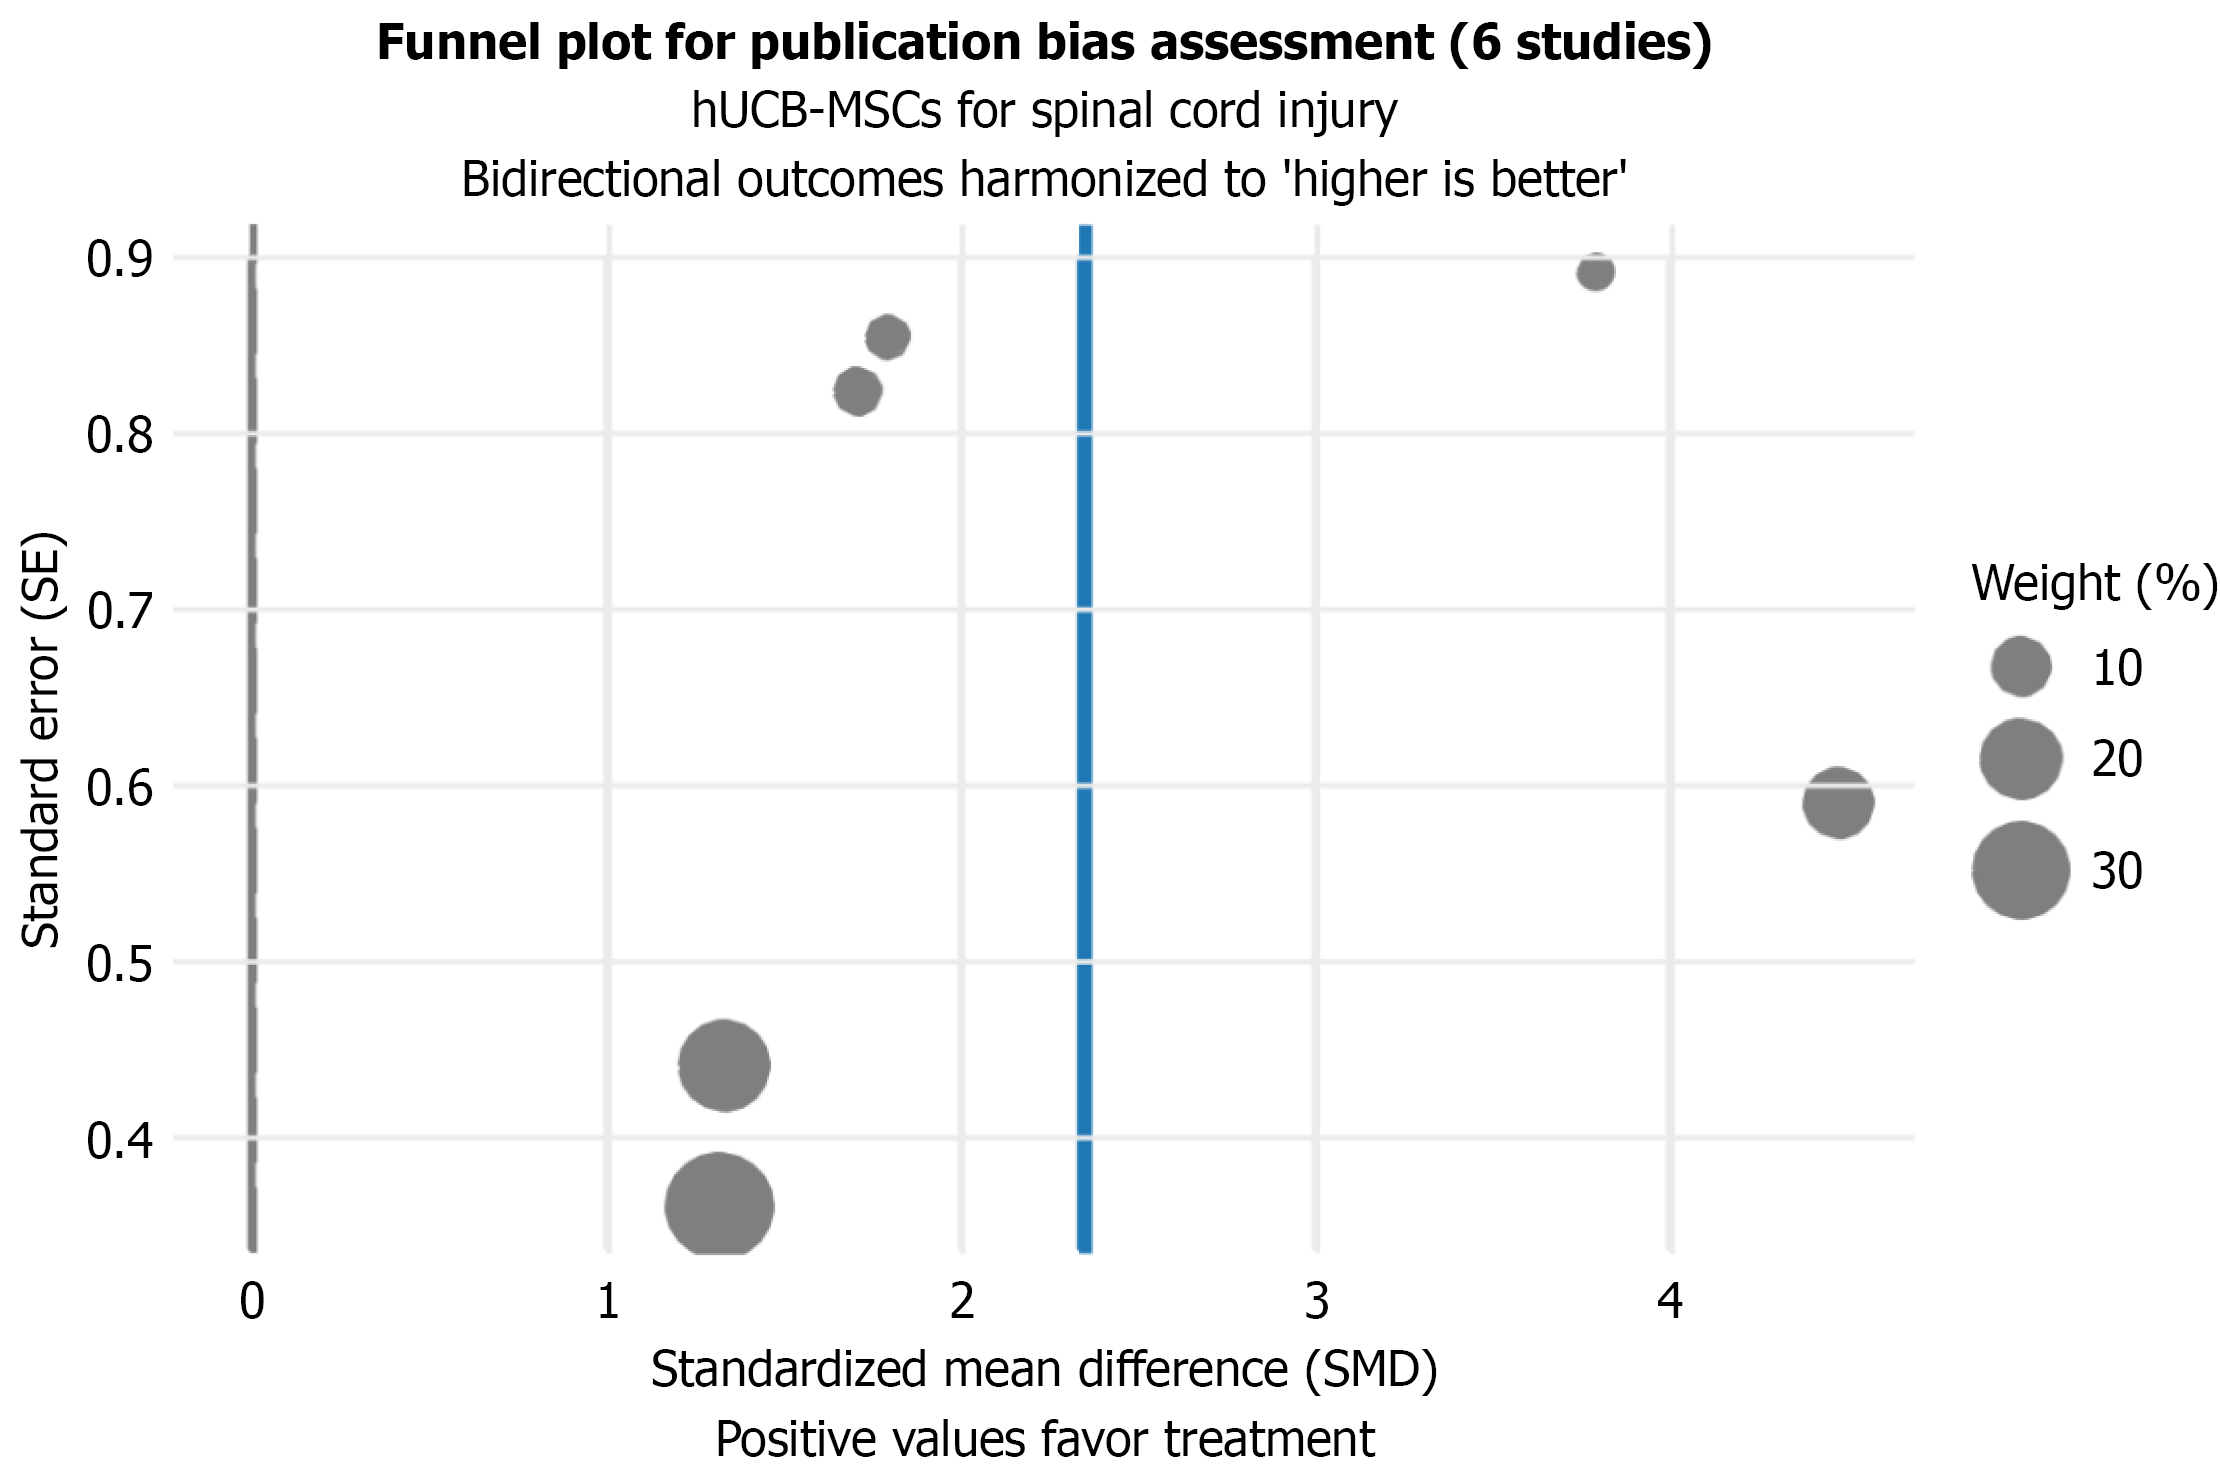
Figure 4 Funnel plot for the assessment of publication bias.
The funnel plot depicts the standard error of each study’s standardized mean difference against its effect size. In the absence of publication bias, studies are expected to distribute roughly symmetrically around the pooled effect estimate (represented by the vertical line at standardized mean difference = 2.35). The size of each dot is proportional to the weight (%) of the individual study in the random-effects model. The distribution appeared roughly symmetrical, and Egger’s test was nonsignificant (P = 0.311); however, with only six studies, neither visual inspection nor formal testing can reliably exclude small-study effects or publication bias. hUCB-MSCs: Human umbilical cord blood-derived mesenchymal stem cells.
- Citation: Liao LQ, Liang RX, Ren ZX, Wang YY, Wei W, Li YS. Human umbilical cord blood-derived mesenchymal stem cell therapy in experimental spinal cord injury: A systematic review and meta-analysis. World J Stem Cells 2026; 18(10): 125423
- URL: https://www.wjgnet.com/1948-0210/full/v18/i10/125423.htm
- DOI: https://dx.doi.org/10.4252/wjsc.125423