
















Copyright: ©Author(s) 2026.
World J Stem Cells. Oct 26, 2026; 18(10): 122760
Published online Oct 26, 2026. doi: 10.4252/wjsc.122760
Published online Oct 26, 2026. doi: 10.4252/wjsc.122760
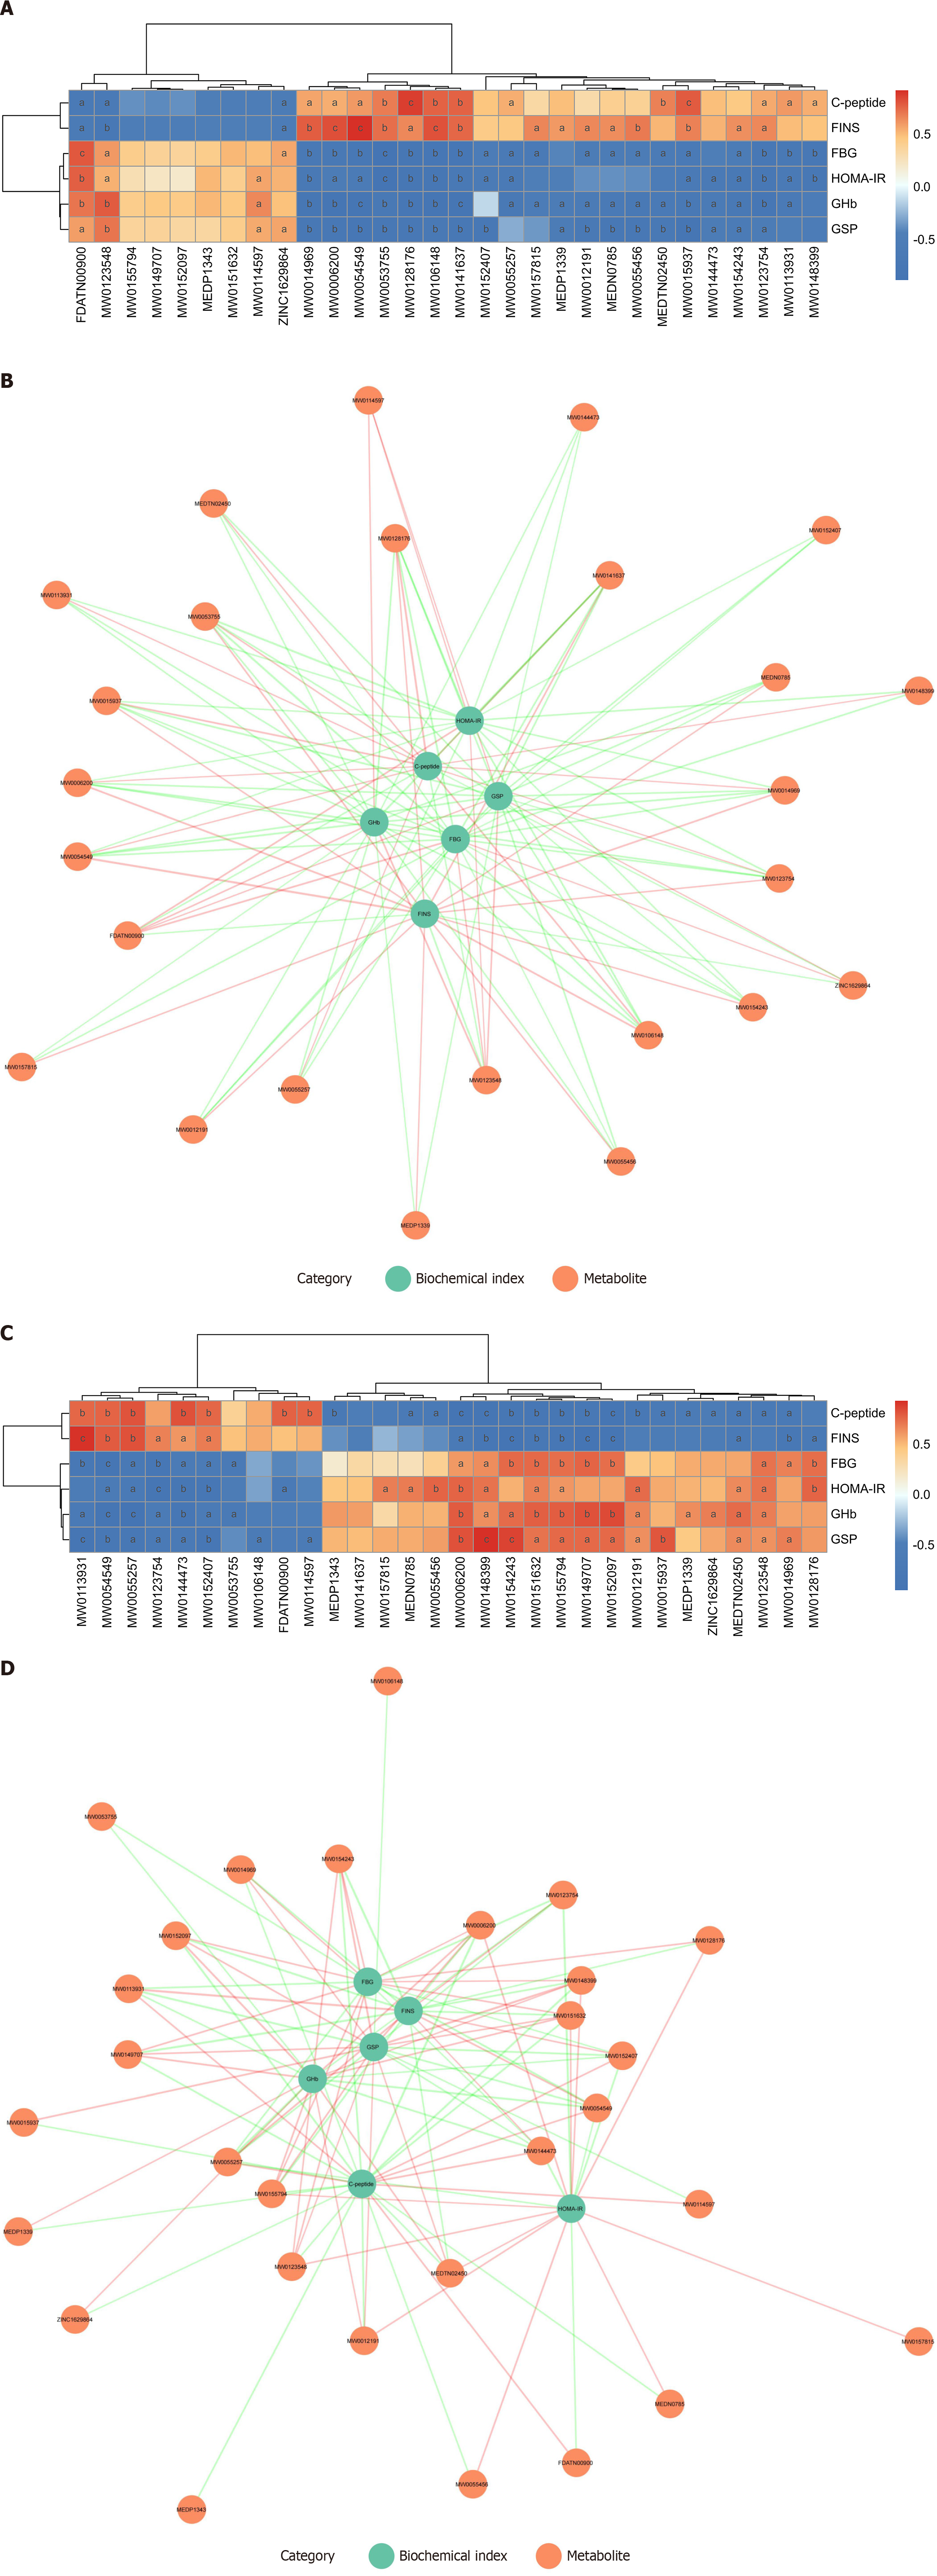
Figure 9 Correlation analysis between key differential metabolites and biochemical indicators in rats from each group.
A: Spearman clustering heatmap illustrates key differential metabolites (KDMs) - biochemical correlations in diabetes mellitus (DM) vs controls, with orange-red indicating positive associations, blue indicating negative associations, and darker shades denoting stronger correlations. aP < 0.05, bP < 0.01, cP < 0.001 for the correlations; B: Spearman correlation network diagram of KDMs and biochemical indicators in the DM vs control groups, where red lines denote positive, green lines denote negative correlations, and line thickness reflects correlation magnitude (P < 0.05); C: Spearman correlation cluster heatmap of KDMs and biochemical indicators in the DM + human umbilical cord mesenchymal stem cells (hUC-MSCs) group vs the DM group; D: Spearman correlation network diagram of KDMs and biochemical indicators in the DM + hUC-MSCs group vs DM group. Control, n = 8; DM, n = 6; DM + hUC-MSCs, n = 5. FINS: Fasting insulin; FBG: Fasting blood glucose; HOMA-IR: Homeostasis model assessment of insulin resistance; GHb: Glycosylated hemoglobin; GSP: Glycosylated serum protein.
- Citation: Xu J, Yang X, Zhang HY, Wang LL, Luo YD, Yang SL, Zhou YJ, Liu Y, Yang XF. Human umbilical cord mesenchymal stem cells repair islet structure and function in diabetic rats through metabolic reprogramming. World J Stem Cells 2026; 18(10): 122760
- URL: https://www.wjgnet.com/1948-0210/full/v18/i10/122760.htm
- DOI: https://dx.doi.org/10.4252/wjsc.122760