
















Copyright: ©Author(s) 2026.
World J Stem Cells. Oct 26, 2026; 18(10): 122760
Published online Oct 26, 2026. doi: 10.4252/wjsc.122760
Published online Oct 26, 2026. doi: 10.4252/wjsc.122760
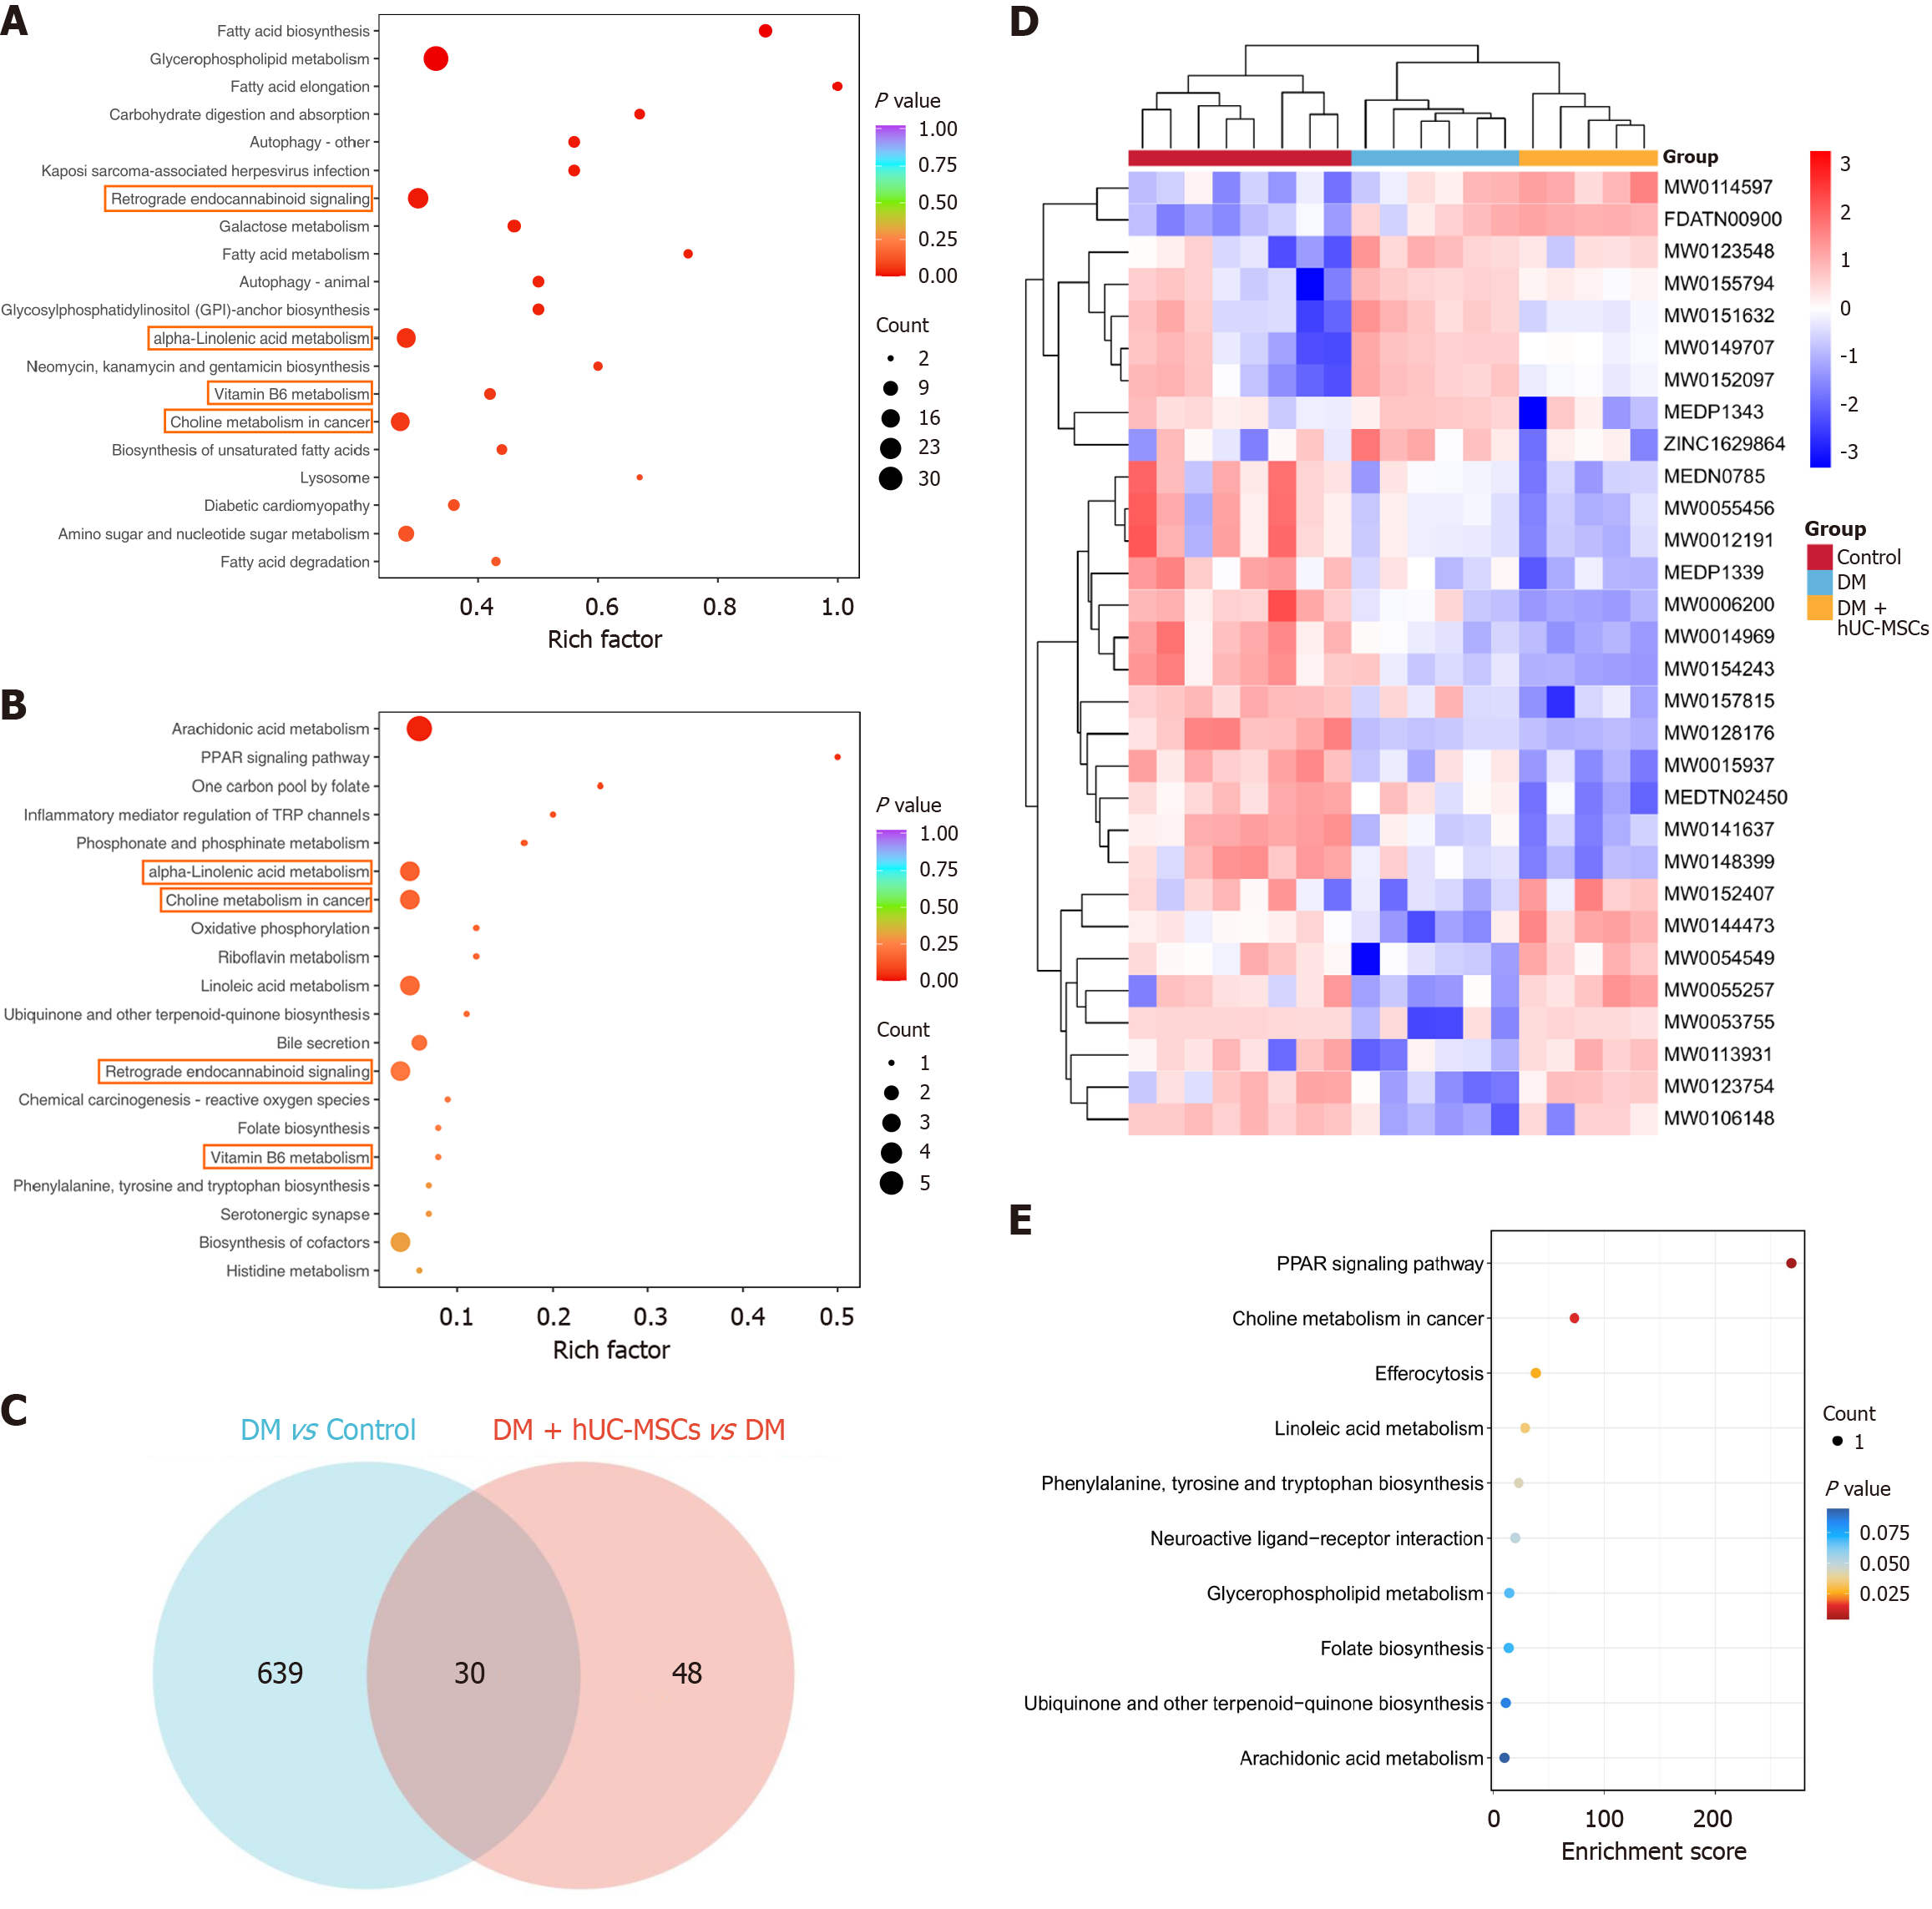
Figure 4 Alterations in pancreatic metabolites and metabolic pathways induced by human umbilical cord mesenchymal stem cells in a rat model of diabetes.
A: Kyoto Encyclopedia of Genes and Genomes (KEGG) enrichment bubble plot depicting differential metabolites between diabetes mellitus (DM) and control rats; B: KEGG enrichment analysis of metabolites differentially expressed after human umbilical cord mesenchymal stem cell intervention relative to the diabetic control group, presented as a bubble plot; C: Venn diagram illustrating key differential metabolites (KDMs) across the indicated group comparisons; D: Heatmap depicting 30 KDMs; E: KEGG enrichment bubble plot for the 30 KDMs. Control, n = 8; DM, n = 6; DM + human umbilical cord mesenchymal stem cells, n = 5. KEGG: Kyoto Encyclopedia of Genes and Genomes; DM: Diabetes mellitus; hUC-MSCs: Human umbilical cord mesenchymal stem cells; PPAR: Peroxisome proliferator-activated receptor.
- Citation: Xu J, Yang X, Zhang HY, Wang LL, Luo YD, Yang SL, Zhou YJ, Liu Y, Yang XF. Human umbilical cord mesenchymal stem cells repair islet structure and function in diabetic rats through metabolic reprogramming. World J Stem Cells 2026; 18(10): 122760
- URL: https://www.wjgnet.com/1948-0210/full/v18/i10/122760.htm
- DOI: https://dx.doi.org/10.4252/wjsc.122760