
















Copyright: ©Author(s) 2026.
World J Stem Cells. Oct 26, 2026; 18(10): 122760
Published online Oct 26, 2026. doi: 10.4252/wjsc.122760
Published online Oct 26, 2026. doi: 10.4252/wjsc.122760
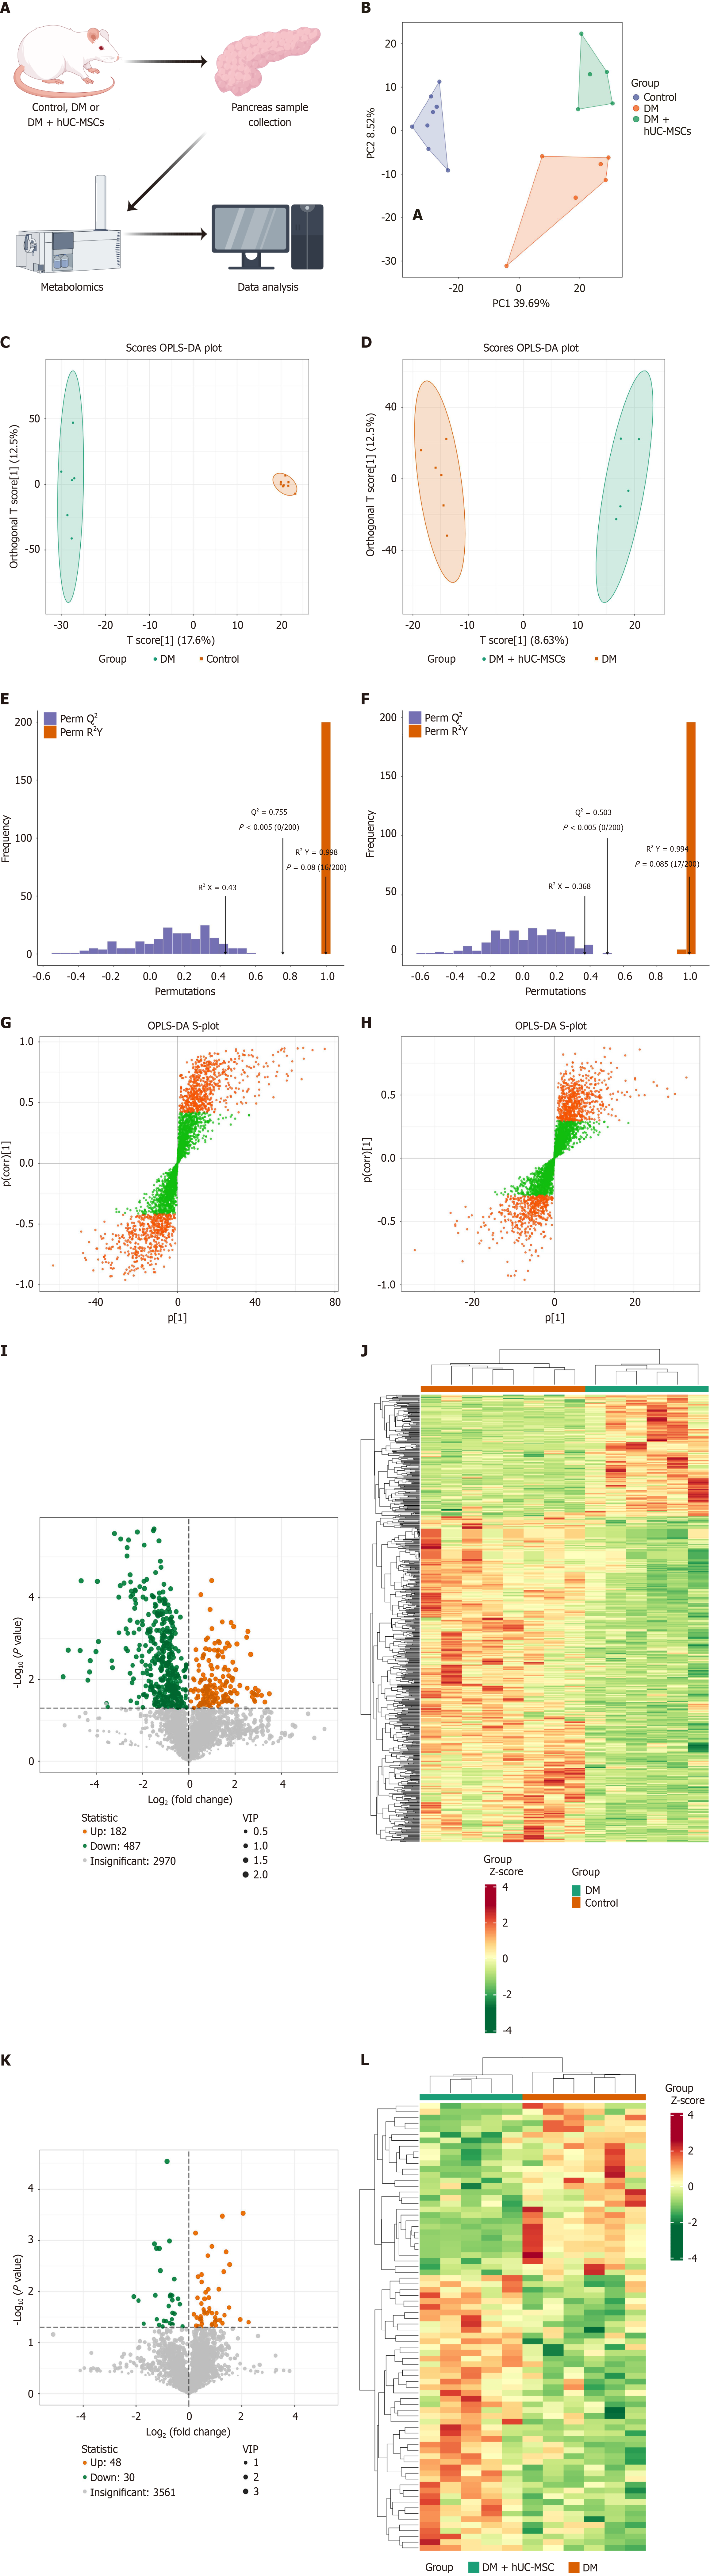
Figure 2 Pancreatic metabolomics data analysis of differential metabolites in rats from different groups.
A: Schematic diagram of pancreatic metabolomic analysis in rats; B: Two-dimensional principal component analysis score scatterplot showing rats across all groups; C: Orthogonal partial least squares-discriminant analysis (OPLS-DA) score scatterplot comparing the control and diabetes mellitus (DM) groups; D: OPLS-DA score scatterplot comparing the DM group with the DM + human umbilical cord mesenchymal stem cells (hUC-MSCs) group; E: Validation plots for OPLS-DA models comparing the control and DM groups; F: Validation plots of OPLS-DA models between the DM group and the DM + hUC-MSCs group; G and H: OPLS-DA S-plots comparing the control and DM groups (G), S-plots from OPLS-DA for the contrast between the DM group and the DM + hUC-MSCs group (H), the orange dots denote metabolites exhibiting variable importance in projection (VIP) > 1, while the green dots correspond to metabolites with VIP ≤ 1; I: Volcano plot depicting differential metabolites in the DM group compared with the control group; J: Clustered heatmap of metabolites with significant differences between the control group and the DM group; K: Volcano plot of differential metabolites between the DM + hUC-MSCs and DM groups; L: Heatmap with hierarchical clustering illustrating differential metabolites between the DM + hUC-MSCs and DM groups. Control, n = 8; DM, n = 6; DM + hUC-MSCs, n = 5. hUC-MSCs: Human umbilical cord mesenchymal stem cells; DM: Diabetes mellitus; OPLS-DA: Orthogonal partial least squares-discriminant analysis; VIP: Variable importance projection.
- Citation: Xu J, Yang X, Zhang HY, Wang LL, Luo YD, Yang SL, Zhou YJ, Liu Y, Yang XF. Human umbilical cord mesenchymal stem cells repair islet structure and function in diabetic rats through metabolic reprogramming. World J Stem Cells 2026; 18(10): 122760
- URL: https://www.wjgnet.com/1948-0210/full/v18/i10/122760.htm
- DOI: https://dx.doi.org/10.4252/wjsc.122760