
















Copyright: ©Author(s) 2026.
World J Stem Cells. Oct 26, 2026; 18(10): 119325
Published online Oct 26, 2026. doi: 10.4252/wjsc.119325
Published online Oct 26, 2026. doi: 10.4252/wjsc.119325
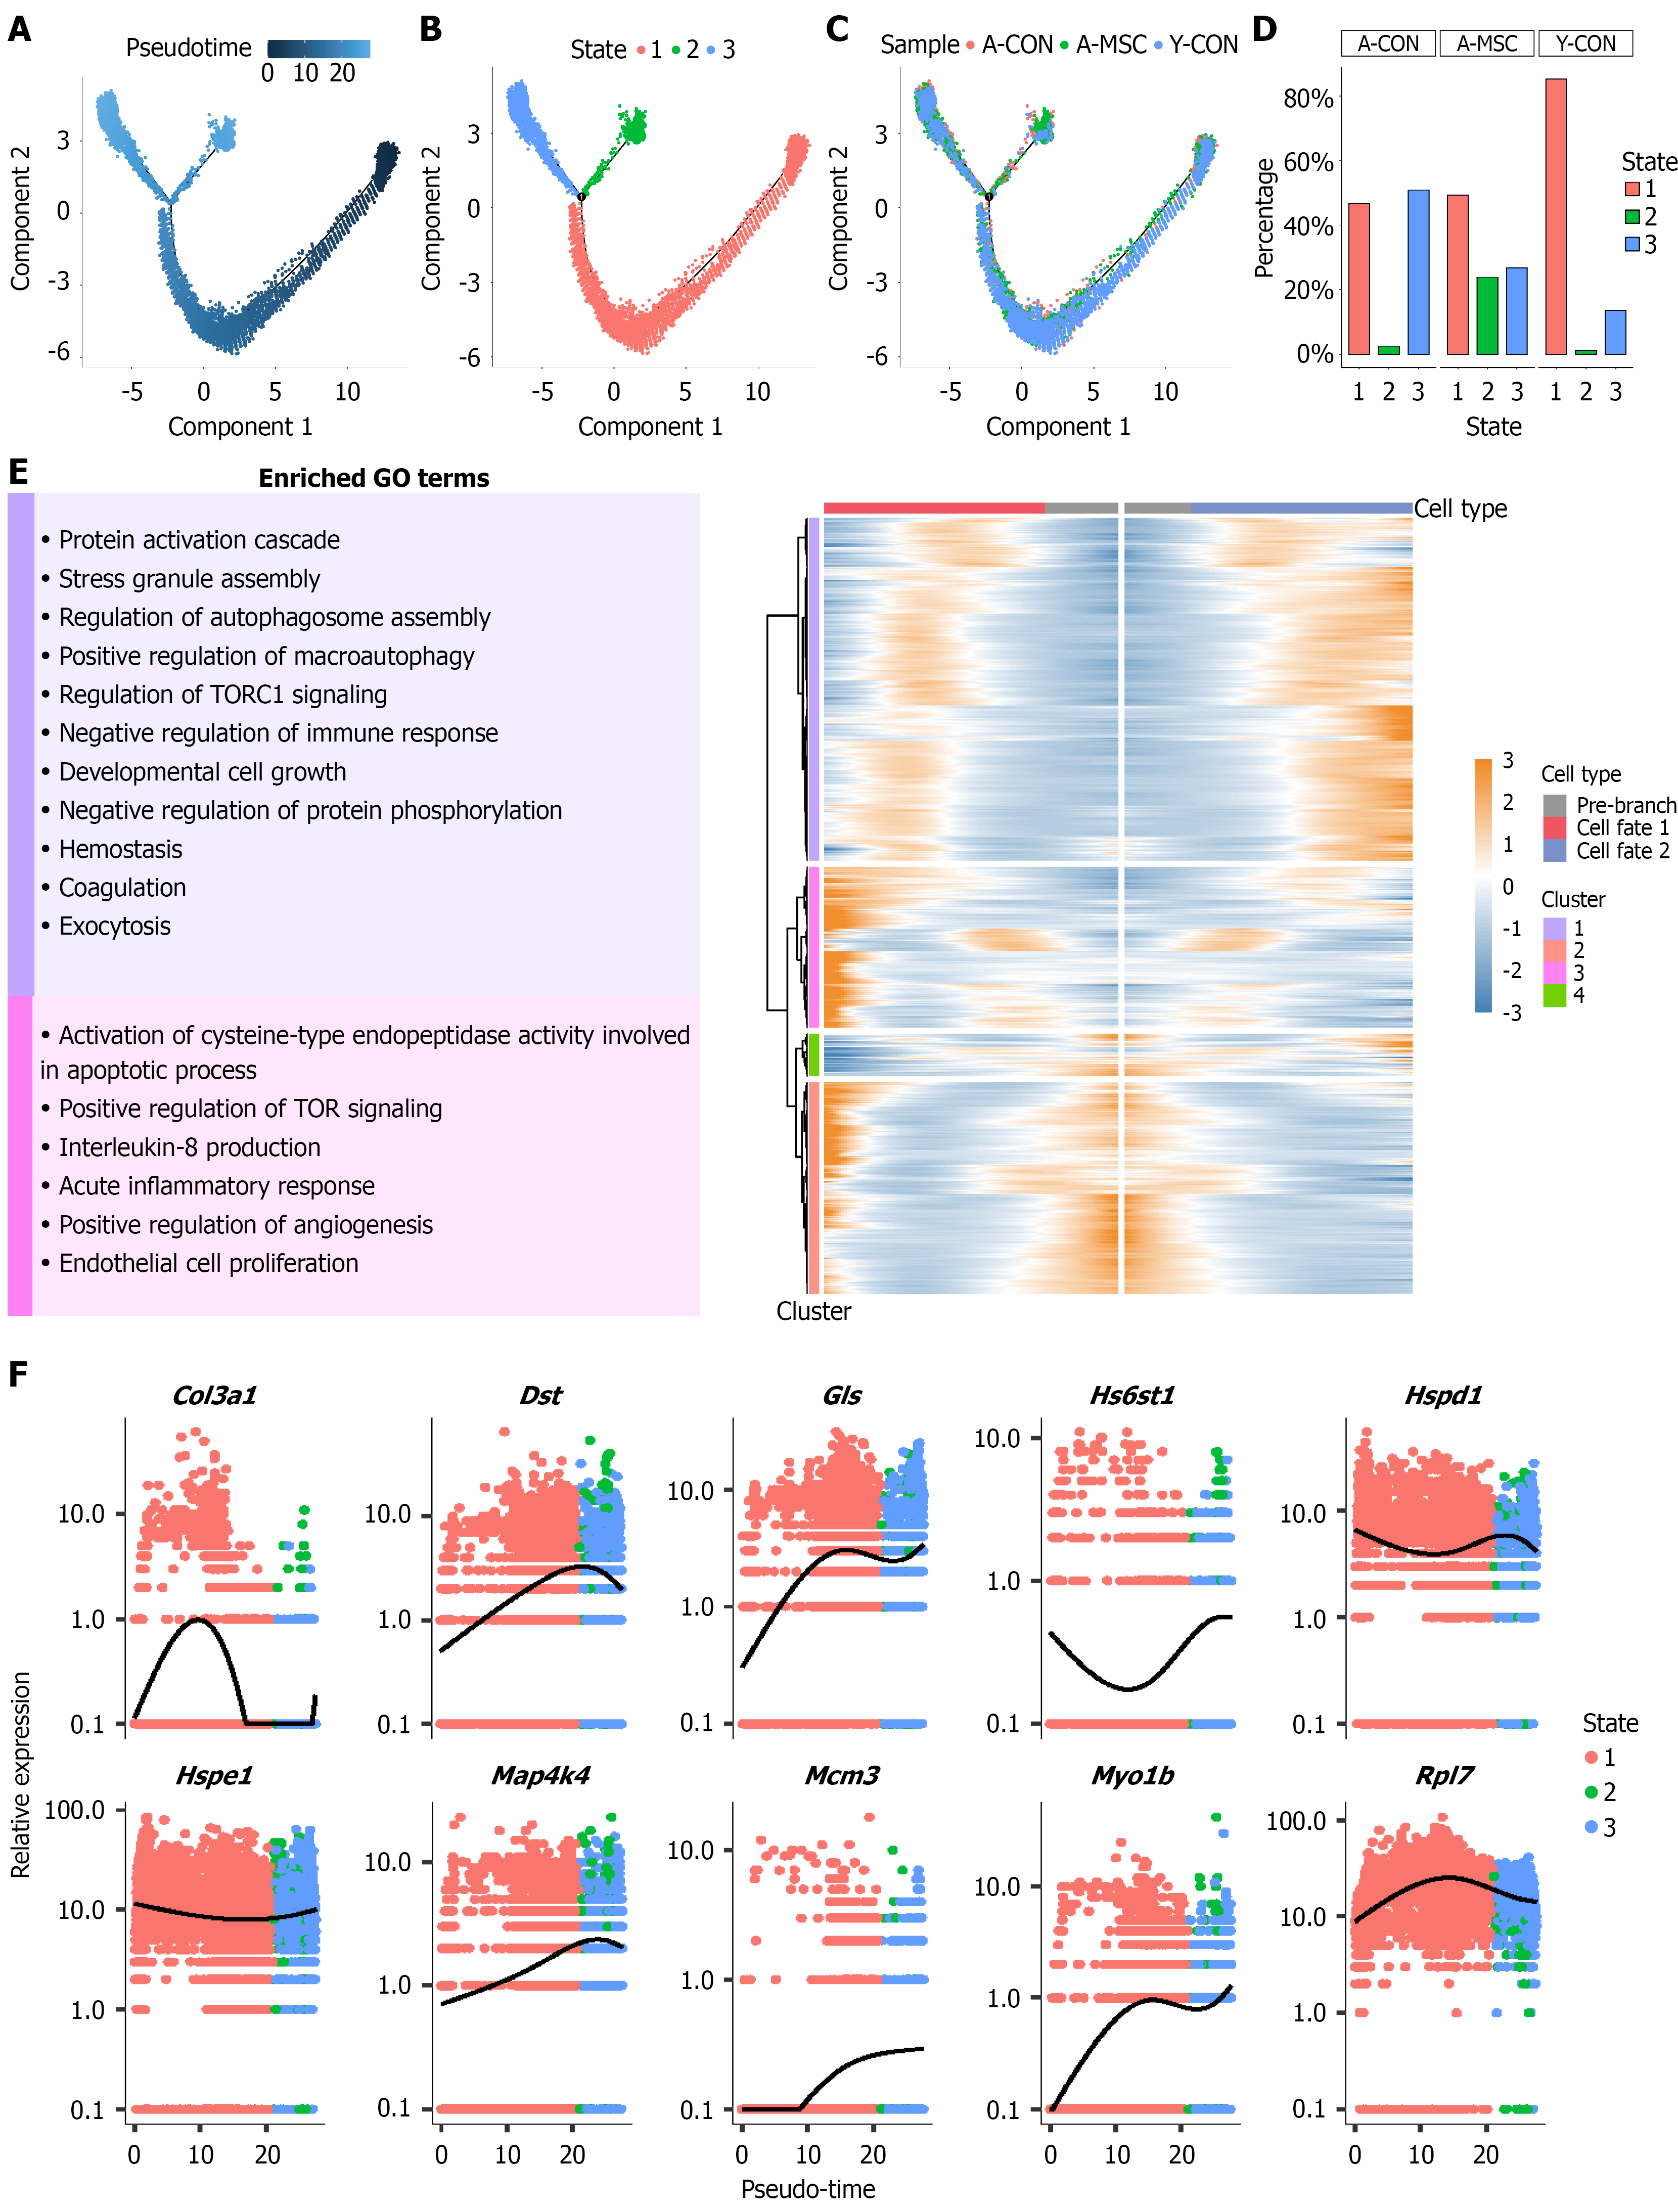
Figure 9 Pseudotime trajectory analysis reveals umbilical cord-derived mesenchymal stem cells reprogram granulosa cell fate in the aged ovary.
A: Pseudotime trajectory analysis of granulosa cells; B: The trajectory reveals three distinct cell states (state 1, 2, 3), with a bifurcation from state 1 leading to two fates (state 2 and state 3); C: Cells are colored by pseudotime and experimental group; D: Bar chart showing the distribution of granulosa cells across the three states in each experimental group. Umbilical cord-derived mesenchymal stem cells transplantation significantly altered the fate distribution, increasing the proportion of cells in state 2 and decreasing the proportion in state 3 compared to the aged control group; E: Heatmap of gene expression dynamics along the two cell fates during the pseudotime trajectory and Gene Ontology enrichment analysis of the biological processes associated with the differentially expressed genes defining cell fate 1 and cell fate 2; F: Expression patterns of the top 10 differentially expressed genes between the two cell fates. Y-CON: Young control; A-CON: Aged control; A-MSC: Umbilical cord-derived mesenchymal stem cell transplantation; GO: Gene Ontology; TORC1: Target of rapamycin complex 1; TOR: Target of rapamycin.
- Citation: Zhang JN, Tian S, Guo XM, Zhang Q, Shang J, Yao YQ. Therapeutic potential of umbilical cord-derived mesenchymal stem cells in ameliorating ovarian aging: Insights from single-cell analysis. World J Stem Cells 2026; 18(10): 119325
- URL: https://www.wjgnet.com/1948-0210/full/v18/i10/119325.htm
- DOI: https://dx.doi.org/10.4252/wjsc.119325