
















Copyright: ©Author(s) 2026.
World J Stem Cells. Oct 26, 2026; 18(10): 119325
Published online Oct 26, 2026. doi: 10.4252/wjsc.119325
Published online Oct 26, 2026. doi: 10.4252/wjsc.119325
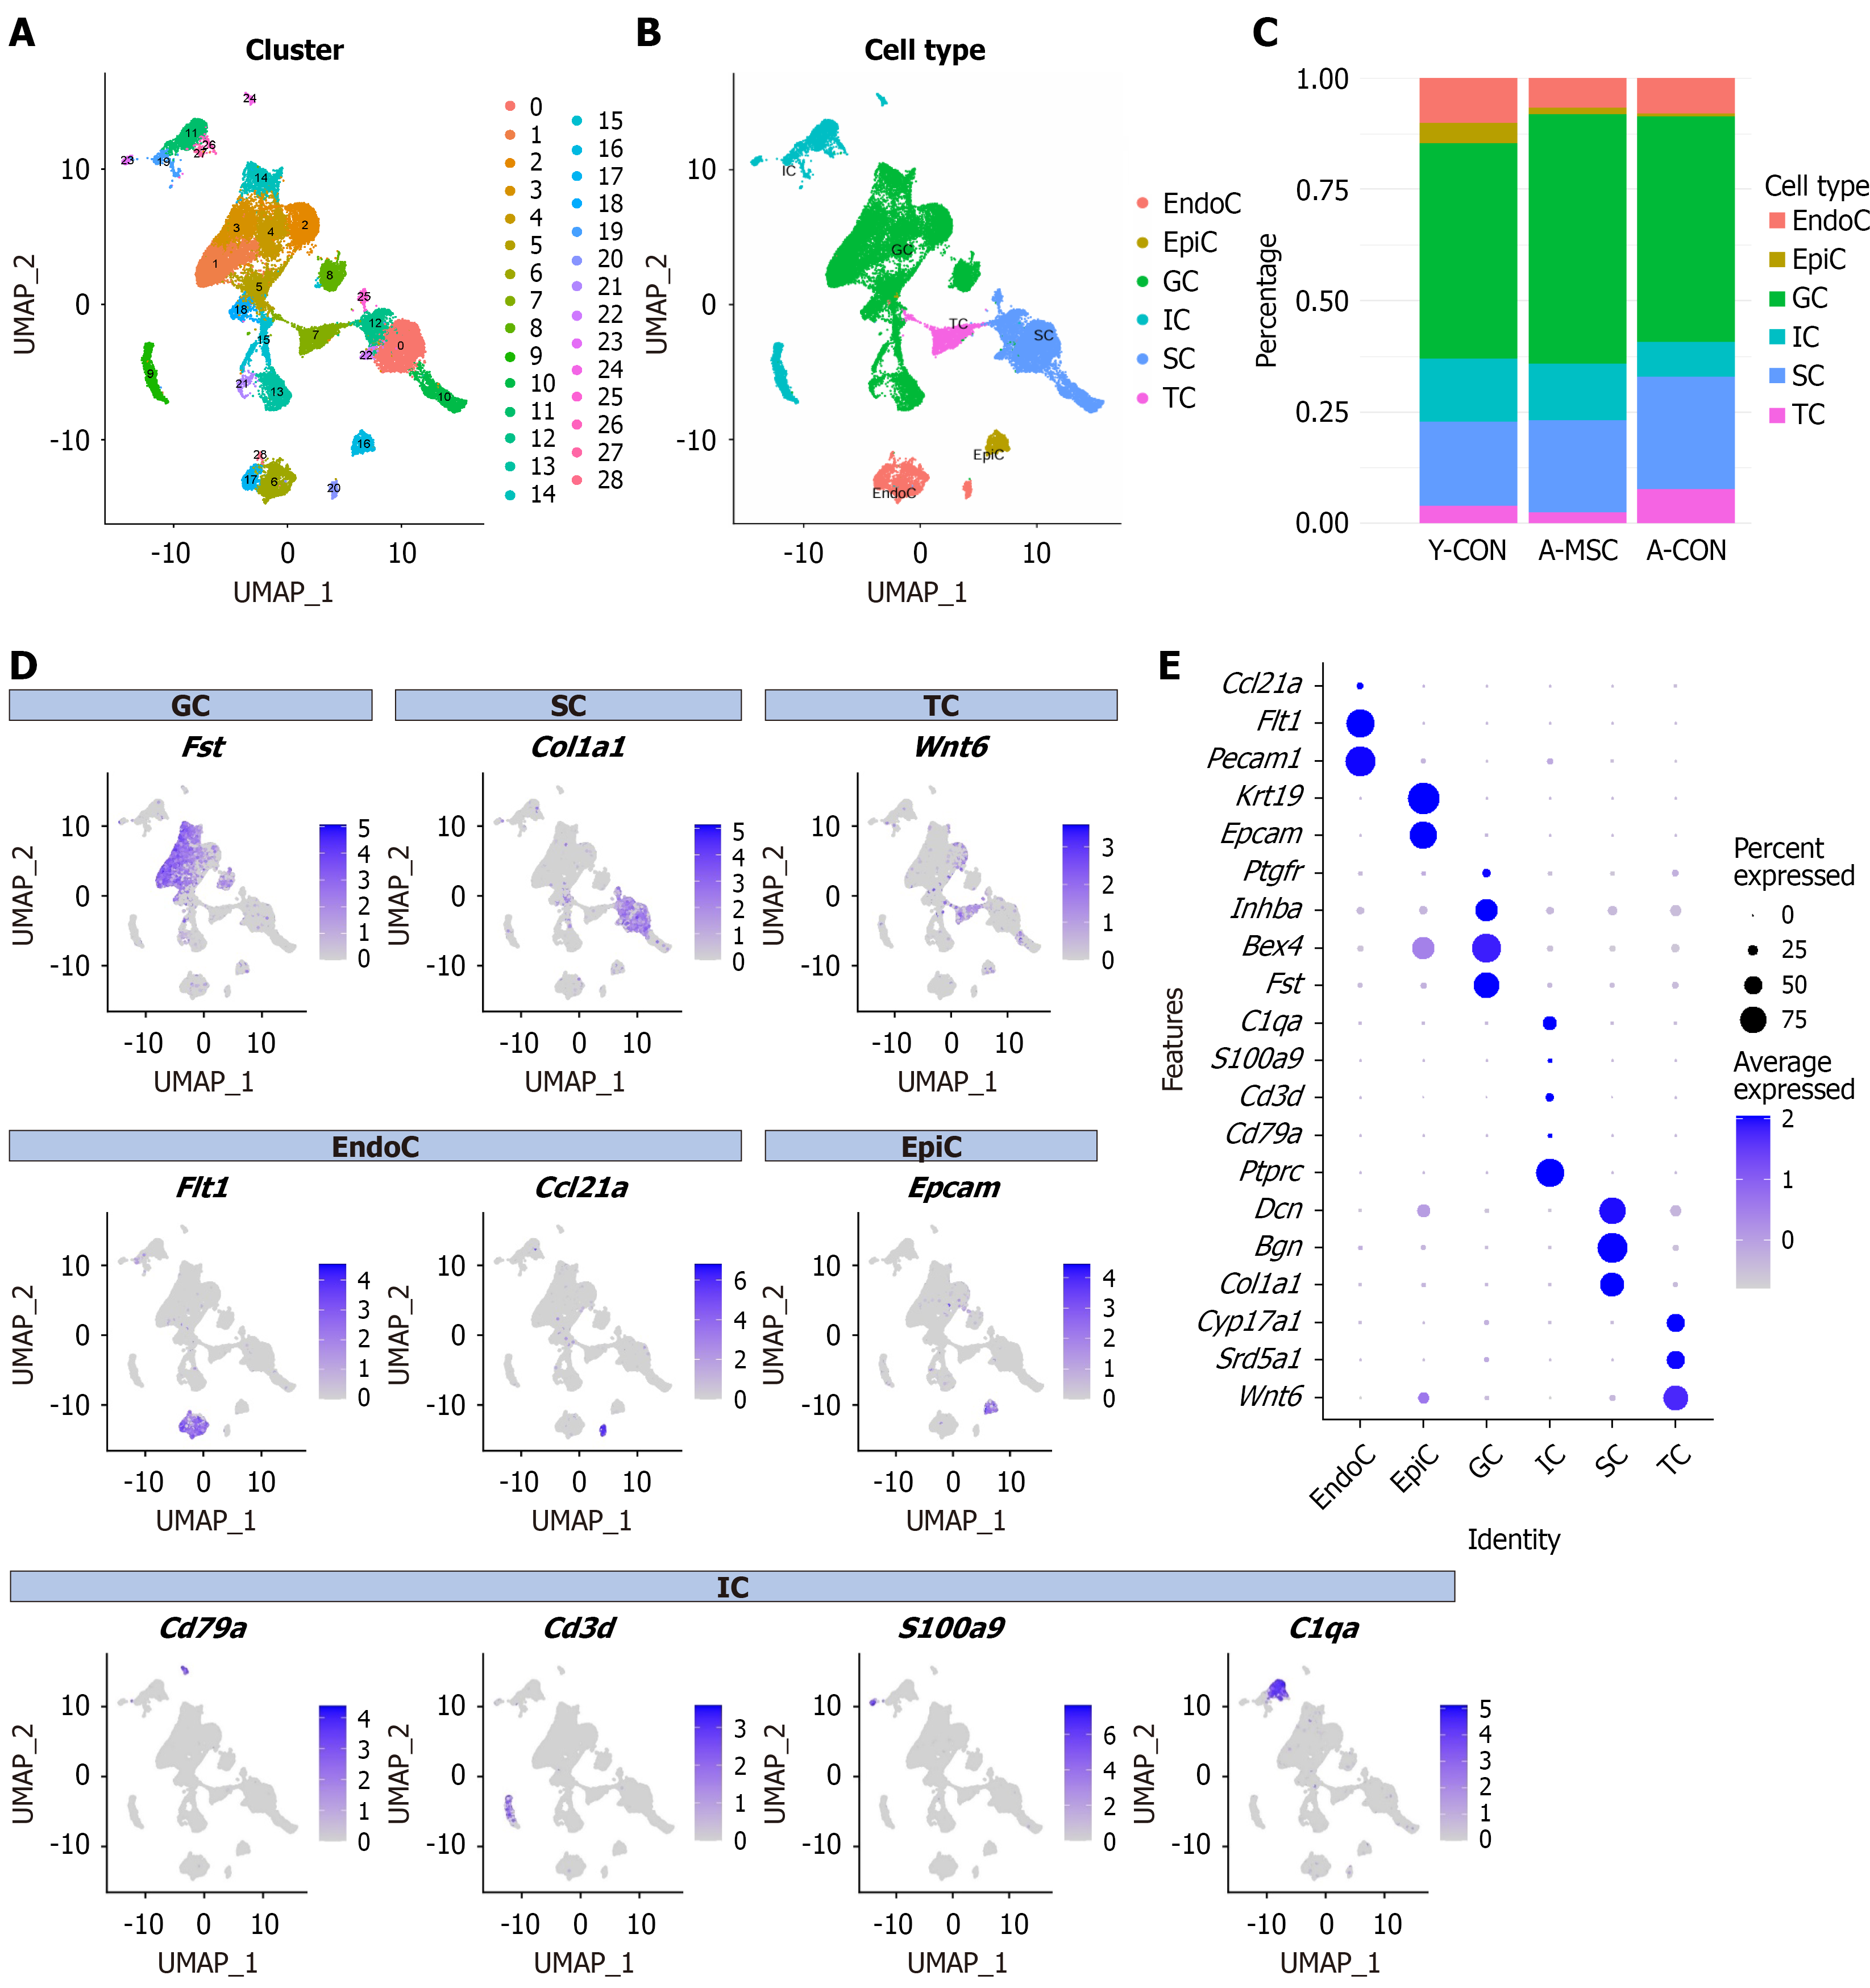
Figure 5 Single-cell transcriptomic profiling defines the ovarian cellular landscape.
A: UMAP visualization of single cells from mouse ovarian tissues, colored by 29 distinct cell clusters; B: UMAP visualization of single cells from mouse ovarian tissues, colored by different cell types; C: Stacked bar plot showing the proportional composition of major ovarian cell types across the three experimental groups; D: Feature plots showing the expression of marker genes used for cell type annotation; E: Dot plots showing the expression of marker genes used for cell type annotation. GC: Granulosa cell; SC: Stromal cell; TC: Theca cell; EndoC: Endothelial cell; EpiC: Epithelial cell; IC: Immune cell.
- Citation: Zhang JN, Tian S, Guo XM, Zhang Q, Shang J, Yao YQ. Therapeutic potential of umbilical cord-derived mesenchymal stem cells in ameliorating ovarian aging: Insights from single-cell analysis. World J Stem Cells 2026; 18(10): 119325
- URL: https://www.wjgnet.com/1948-0210/full/v18/i10/119325.htm
- DOI: https://dx.doi.org/10.4252/wjsc.119325