
















©The Author(s) 2026.
World J Stem Cells. Jan 26, 2026; 18(1): 111348
Published online Jan 26, 2026. doi: 10.4252/wjsc.v18.i1.111348
Published online Jan 26, 2026. doi: 10.4252/wjsc.v18.i1.111348
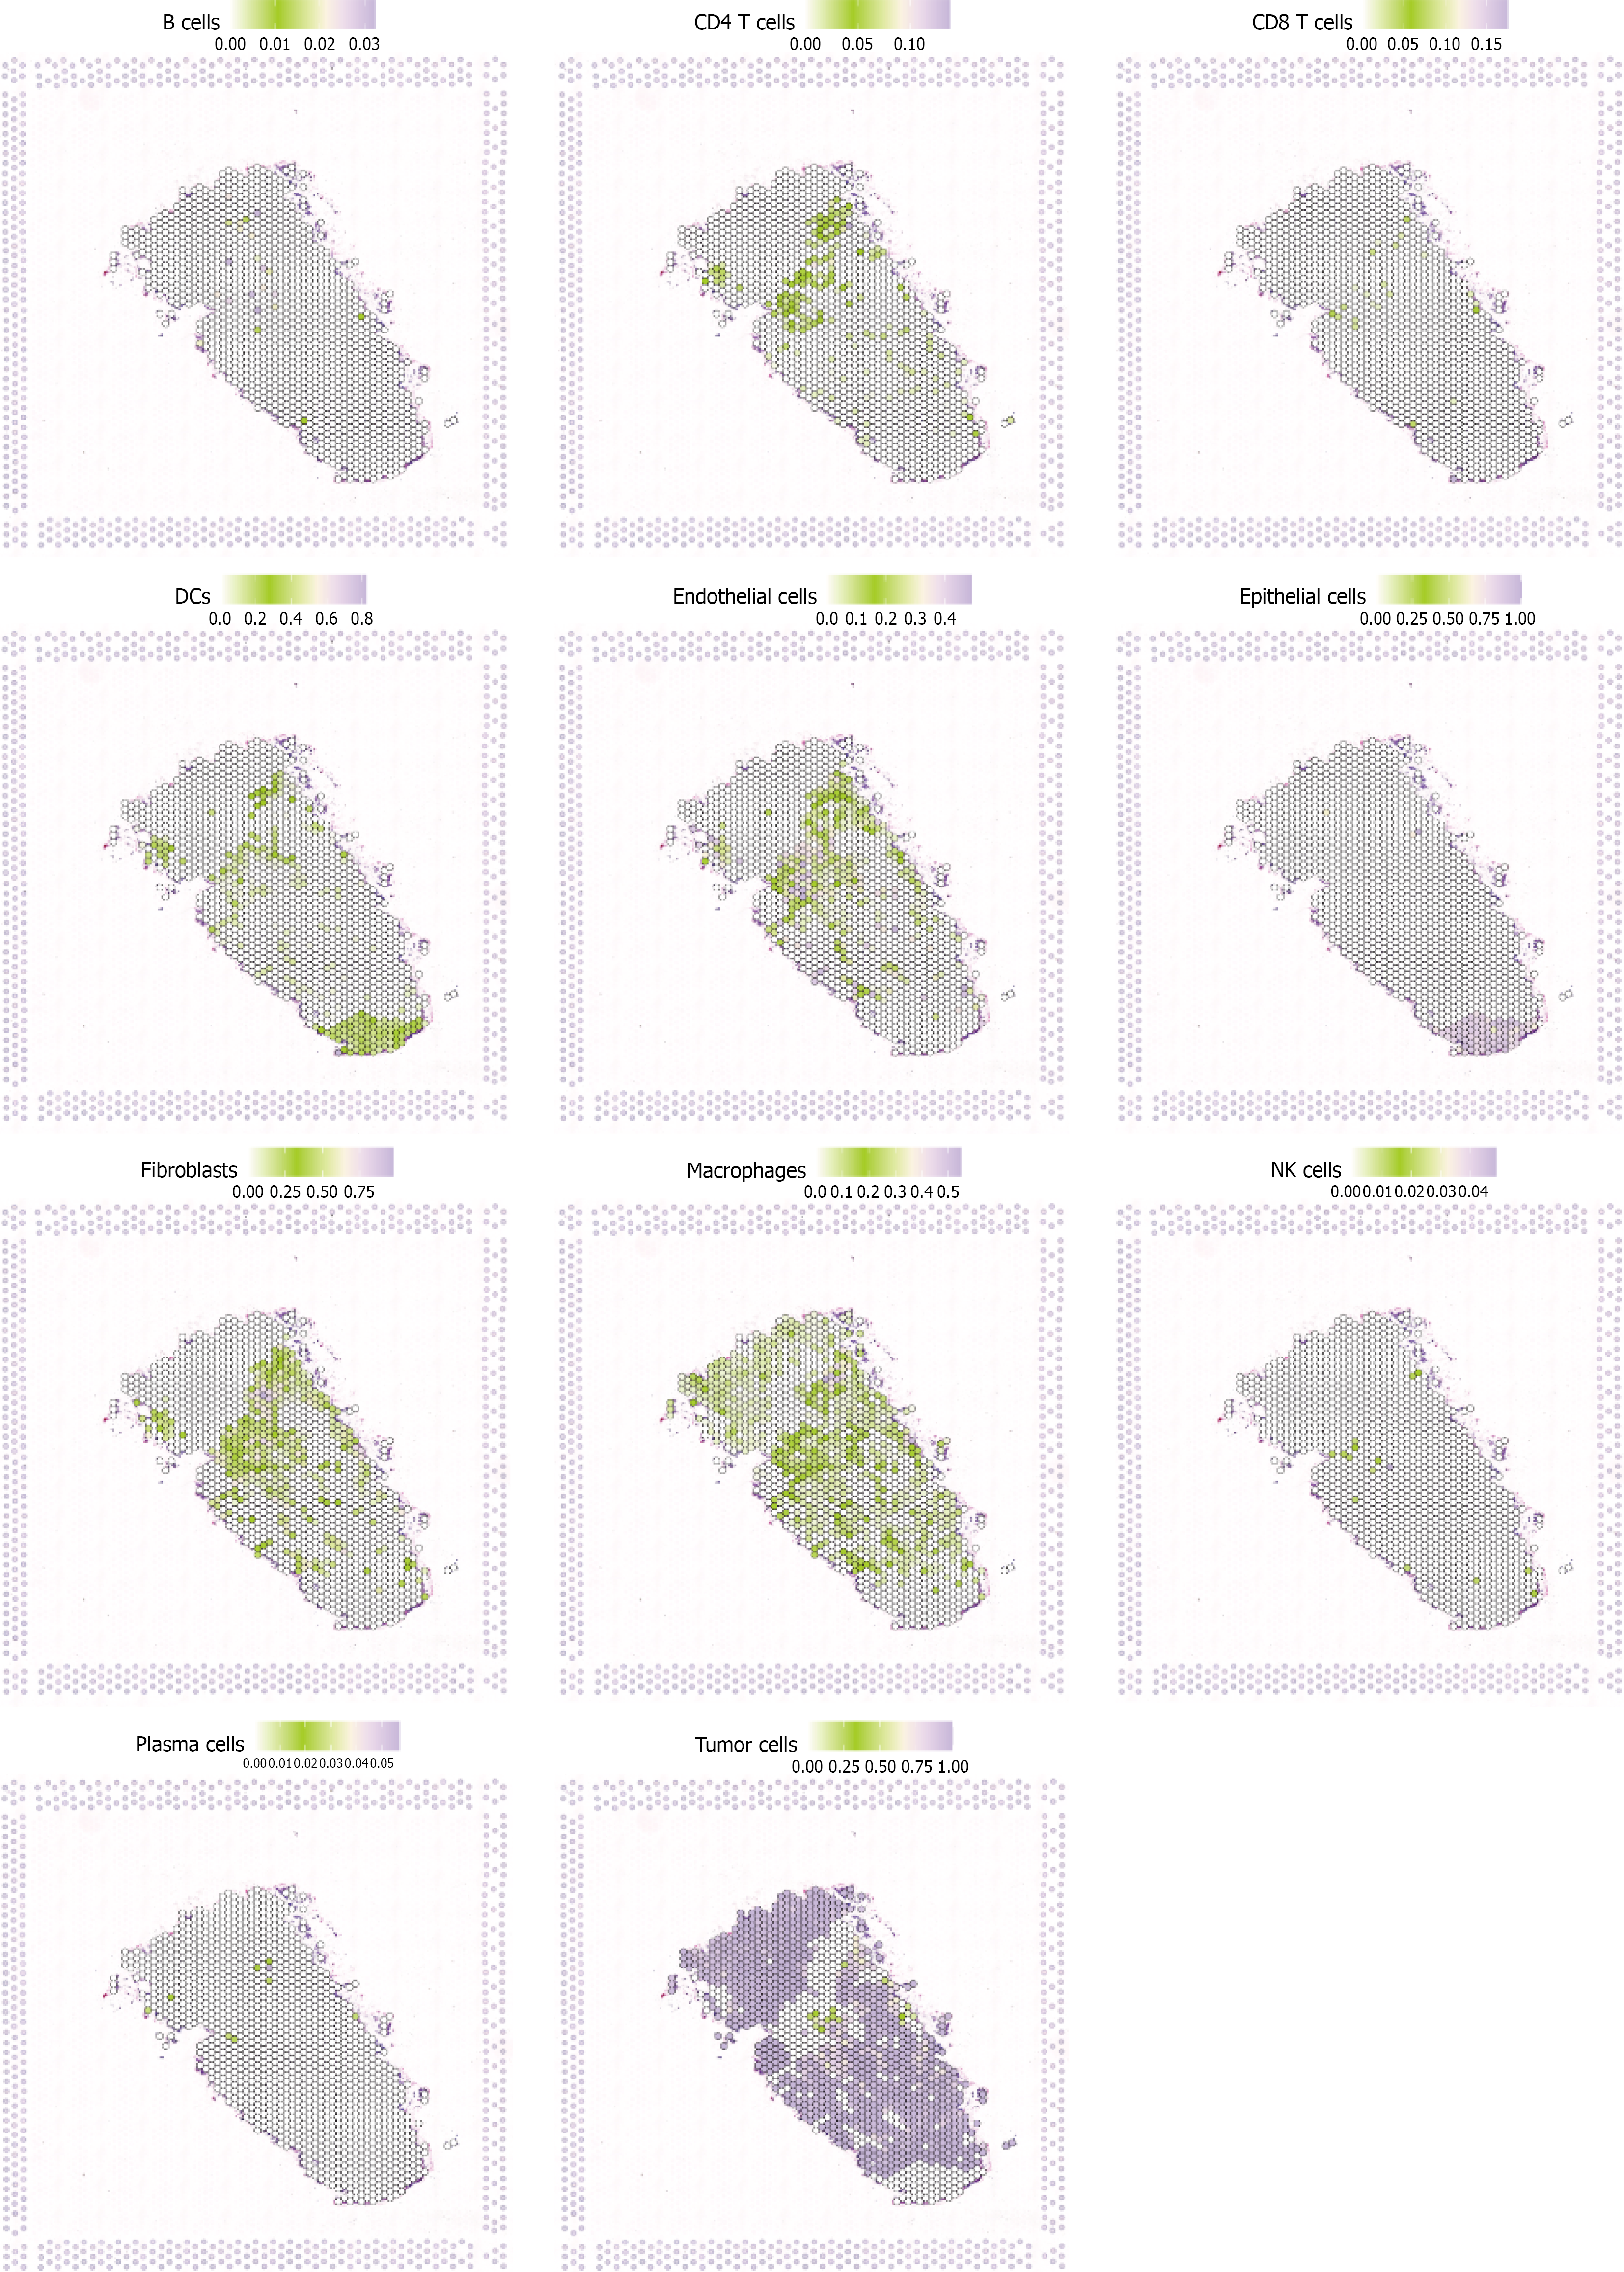
Figure 7 Spatial expression patterns of key stem cell-related genes in breast cancer tissues.
Spatial transcriptomic analysis showing the expression distribution of 11 core genes selected by least absolute shrinkage and selection operator regression, including BCL6, COL7A2, COL15A1, BCL6, CosmicPairs, EphrinMulti, macrophages, MXRA8, fibronectin, macrophage, and TumorCells. Expression levels are indicated by color intensity (green to purple scale), with gray areas representing low or no expression. The analysis reveals heterogeneous spatial distribution patterns, with some genes showing localized expression in specific tumor regions while others display broader tissue distribution or gradient patterns from tumor center to periphery.
- Citation: Guo DY, Liu ZY, Yi QC. Breast cancer stem cell activity driven by ME18D gene expression in the tumor microenvironment. World J Stem Cells 2026; 18(1): 111348
- URL: https://www.wjgnet.com/1948-0210/full/v18/i1/111348.htm
- DOI: https://dx.doi.org/10.4252/wjsc.v18.i1.111348