
















©The Author(s) 2026.
World J Stem Cells. Jan 26, 2026; 18(1): 111348
Published online Jan 26, 2026. doi: 10.4252/wjsc.v18.i1.111348
Published online Jan 26, 2026. doi: 10.4252/wjsc.v18.i1.111348
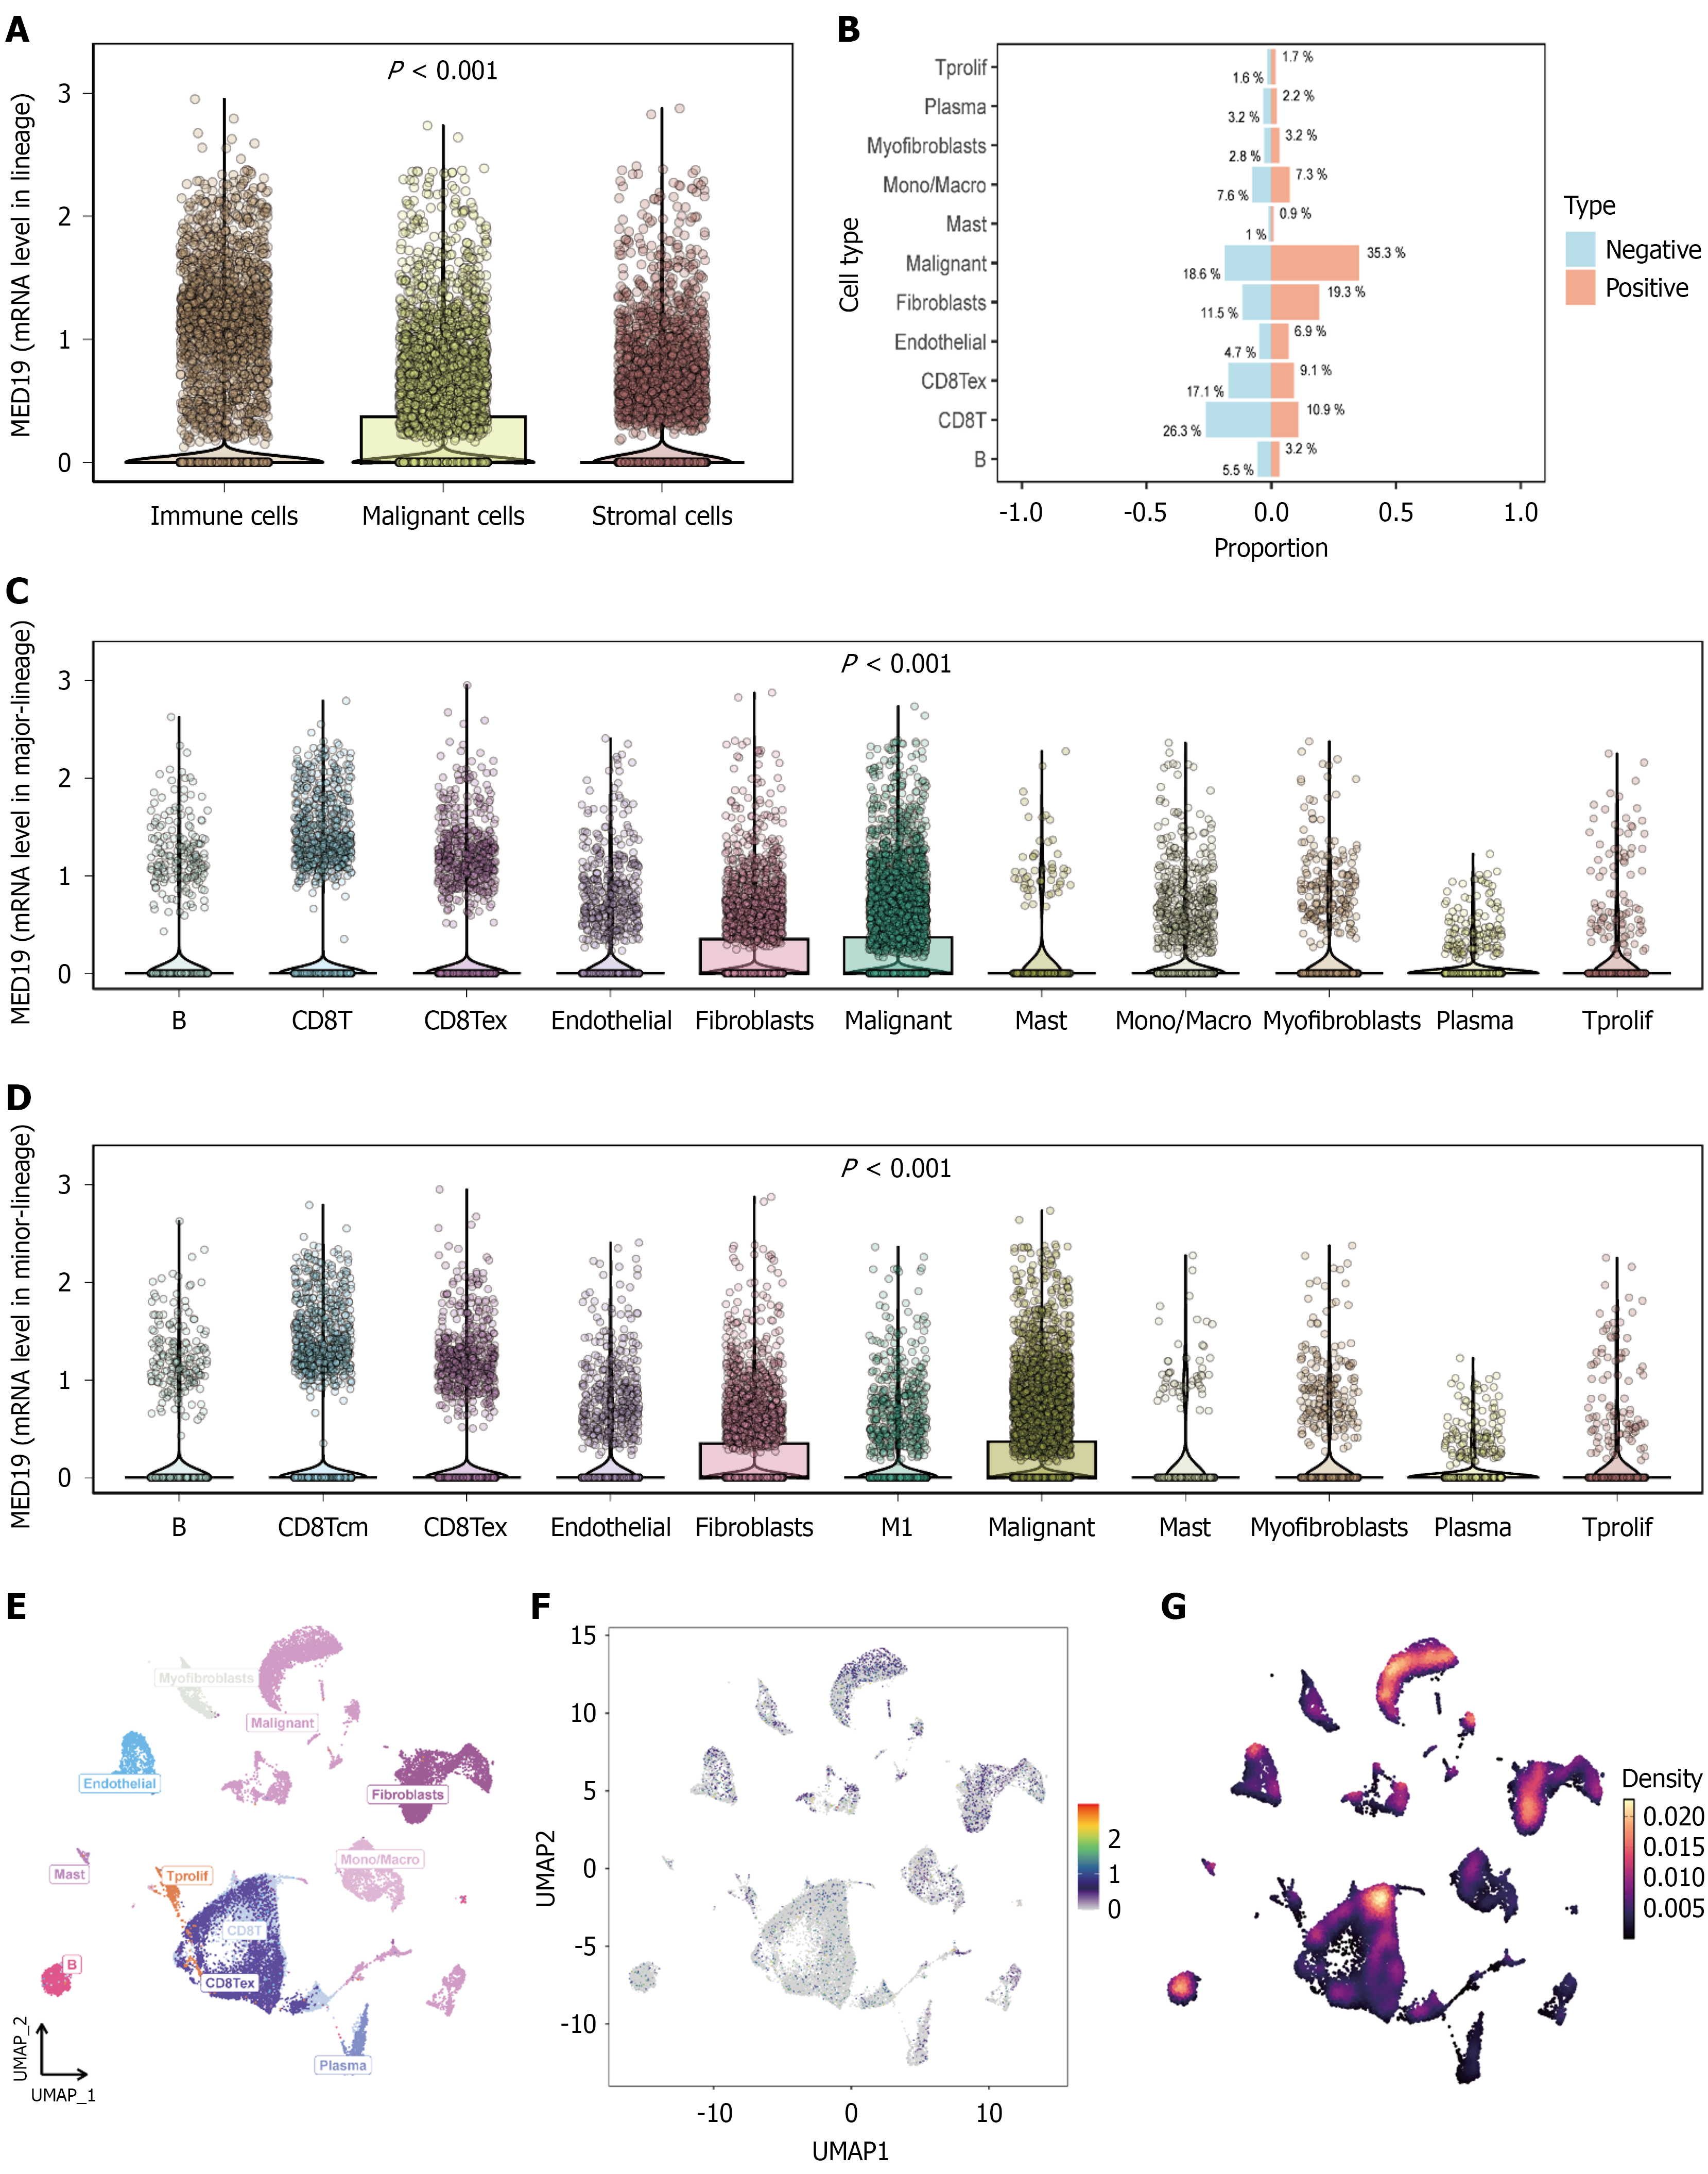
Figure 4 Validation of risk score model and single-cell transcriptomic analysis.
A: Risk score distribution showing significant differences between high-risk and low-risk groups (P < 0.001); B: Clinical feature correlation analysis displaying associations between risk scores and various clinicopathological characteristics; C and D: Expression validation of core model genes demonstrating significant differential patterns between risk groups (P < 0.001); E and F: T-SNE visualization of single-cell RNA sequencing data revealing distinct cell subpopulations with different transcriptional characteristics; G: Cell type annotation showing subpopulations with stem cell-like features characterized by high expression of pluripotency and self-renewal genes.
- Citation: Guo DY, Liu ZY, Yi QC. Breast cancer stem cell activity driven by ME18D gene expression in the tumor microenvironment. World J Stem Cells 2026; 18(1): 111348
- URL: https://www.wjgnet.com/1948-0210/full/v18/i1/111348.htm
- DOI: https://dx.doi.org/10.4252/wjsc.v18.i1.111348