
















©The Author(s) 2026.
World J Stem Cells. Jan 26, 2026; 18(1): 111348
Published online Jan 26, 2026. doi: 10.4252/wjsc.v18.i1.111348
Published online Jan 26, 2026. doi: 10.4252/wjsc.v18.i1.111348
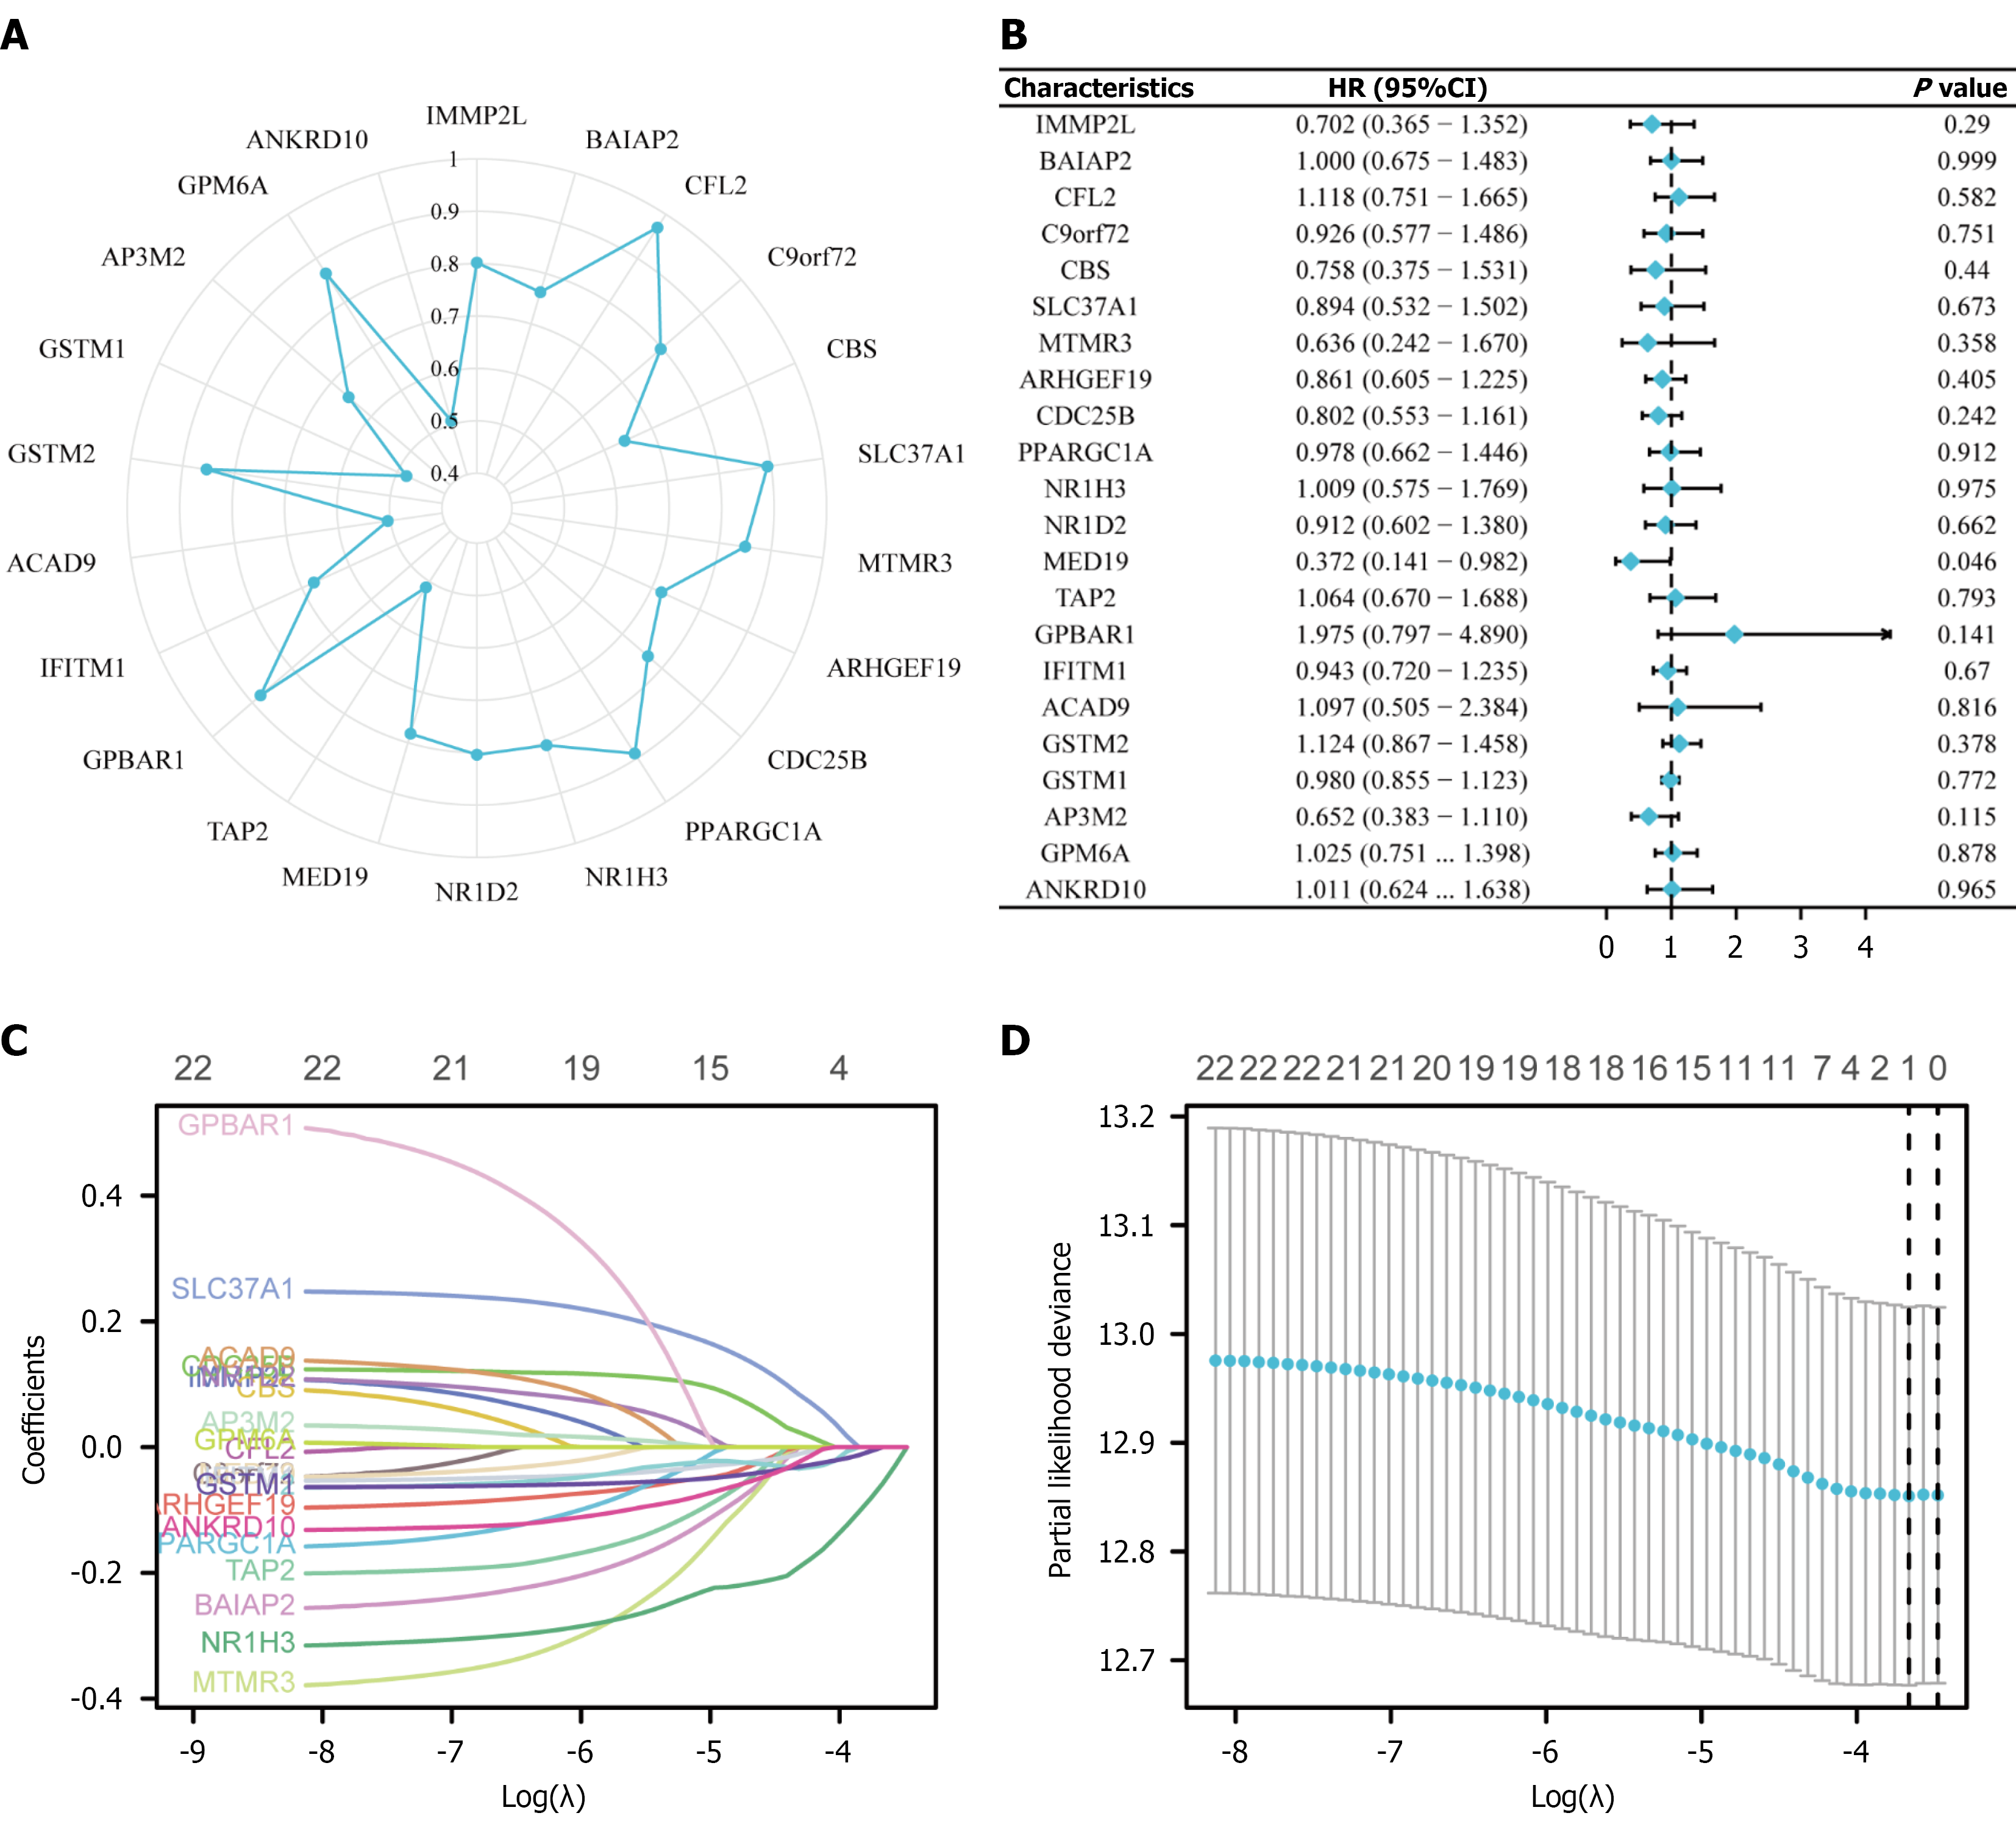
Figure 3 Least absolute shrinkage and selection operator regression analysis for breast cancer stem cell prognostic model construction.
A: Protein-protein interaction network showing key regulatory genes including ANKHD1, DMAP1, BAIAP2, GSTM1, and PPARGC1A; B: Forest plot displaying hazard ratios and 95% confidence intervals for candidate genes, with most genes showing protective effects (hazard ratio < 1); C: Least absolute shrinkage and selection operator coefficient trajectory plot showing gene coefficient changes as penalty parameter λ increases, with gene numbers indicated at the top; D: Ten-fold cross-validation plot identifying optimal λ value (logλ ≈ -5.5) with minimum partial likelihood deviance, retaining 10 genes for the final prognostic model.
- Citation: Guo DY, Liu ZY, Yi QC. Breast cancer stem cell activity driven by ME18D gene expression in the tumor microenvironment. World J Stem Cells 2026; 18(1): 111348
- URL: https://www.wjgnet.com/1948-0210/full/v18/i1/111348.htm
- DOI: https://dx.doi.org/10.4252/wjsc.v18.i1.111348