
















©The Author(s) 2026.
World J Stem Cells. Jan 26, 2026; 18(1): 111348
Published online Jan 26, 2026. doi: 10.4252/wjsc.v18.i1.111348
Published online Jan 26, 2026. doi: 10.4252/wjsc.v18.i1.111348
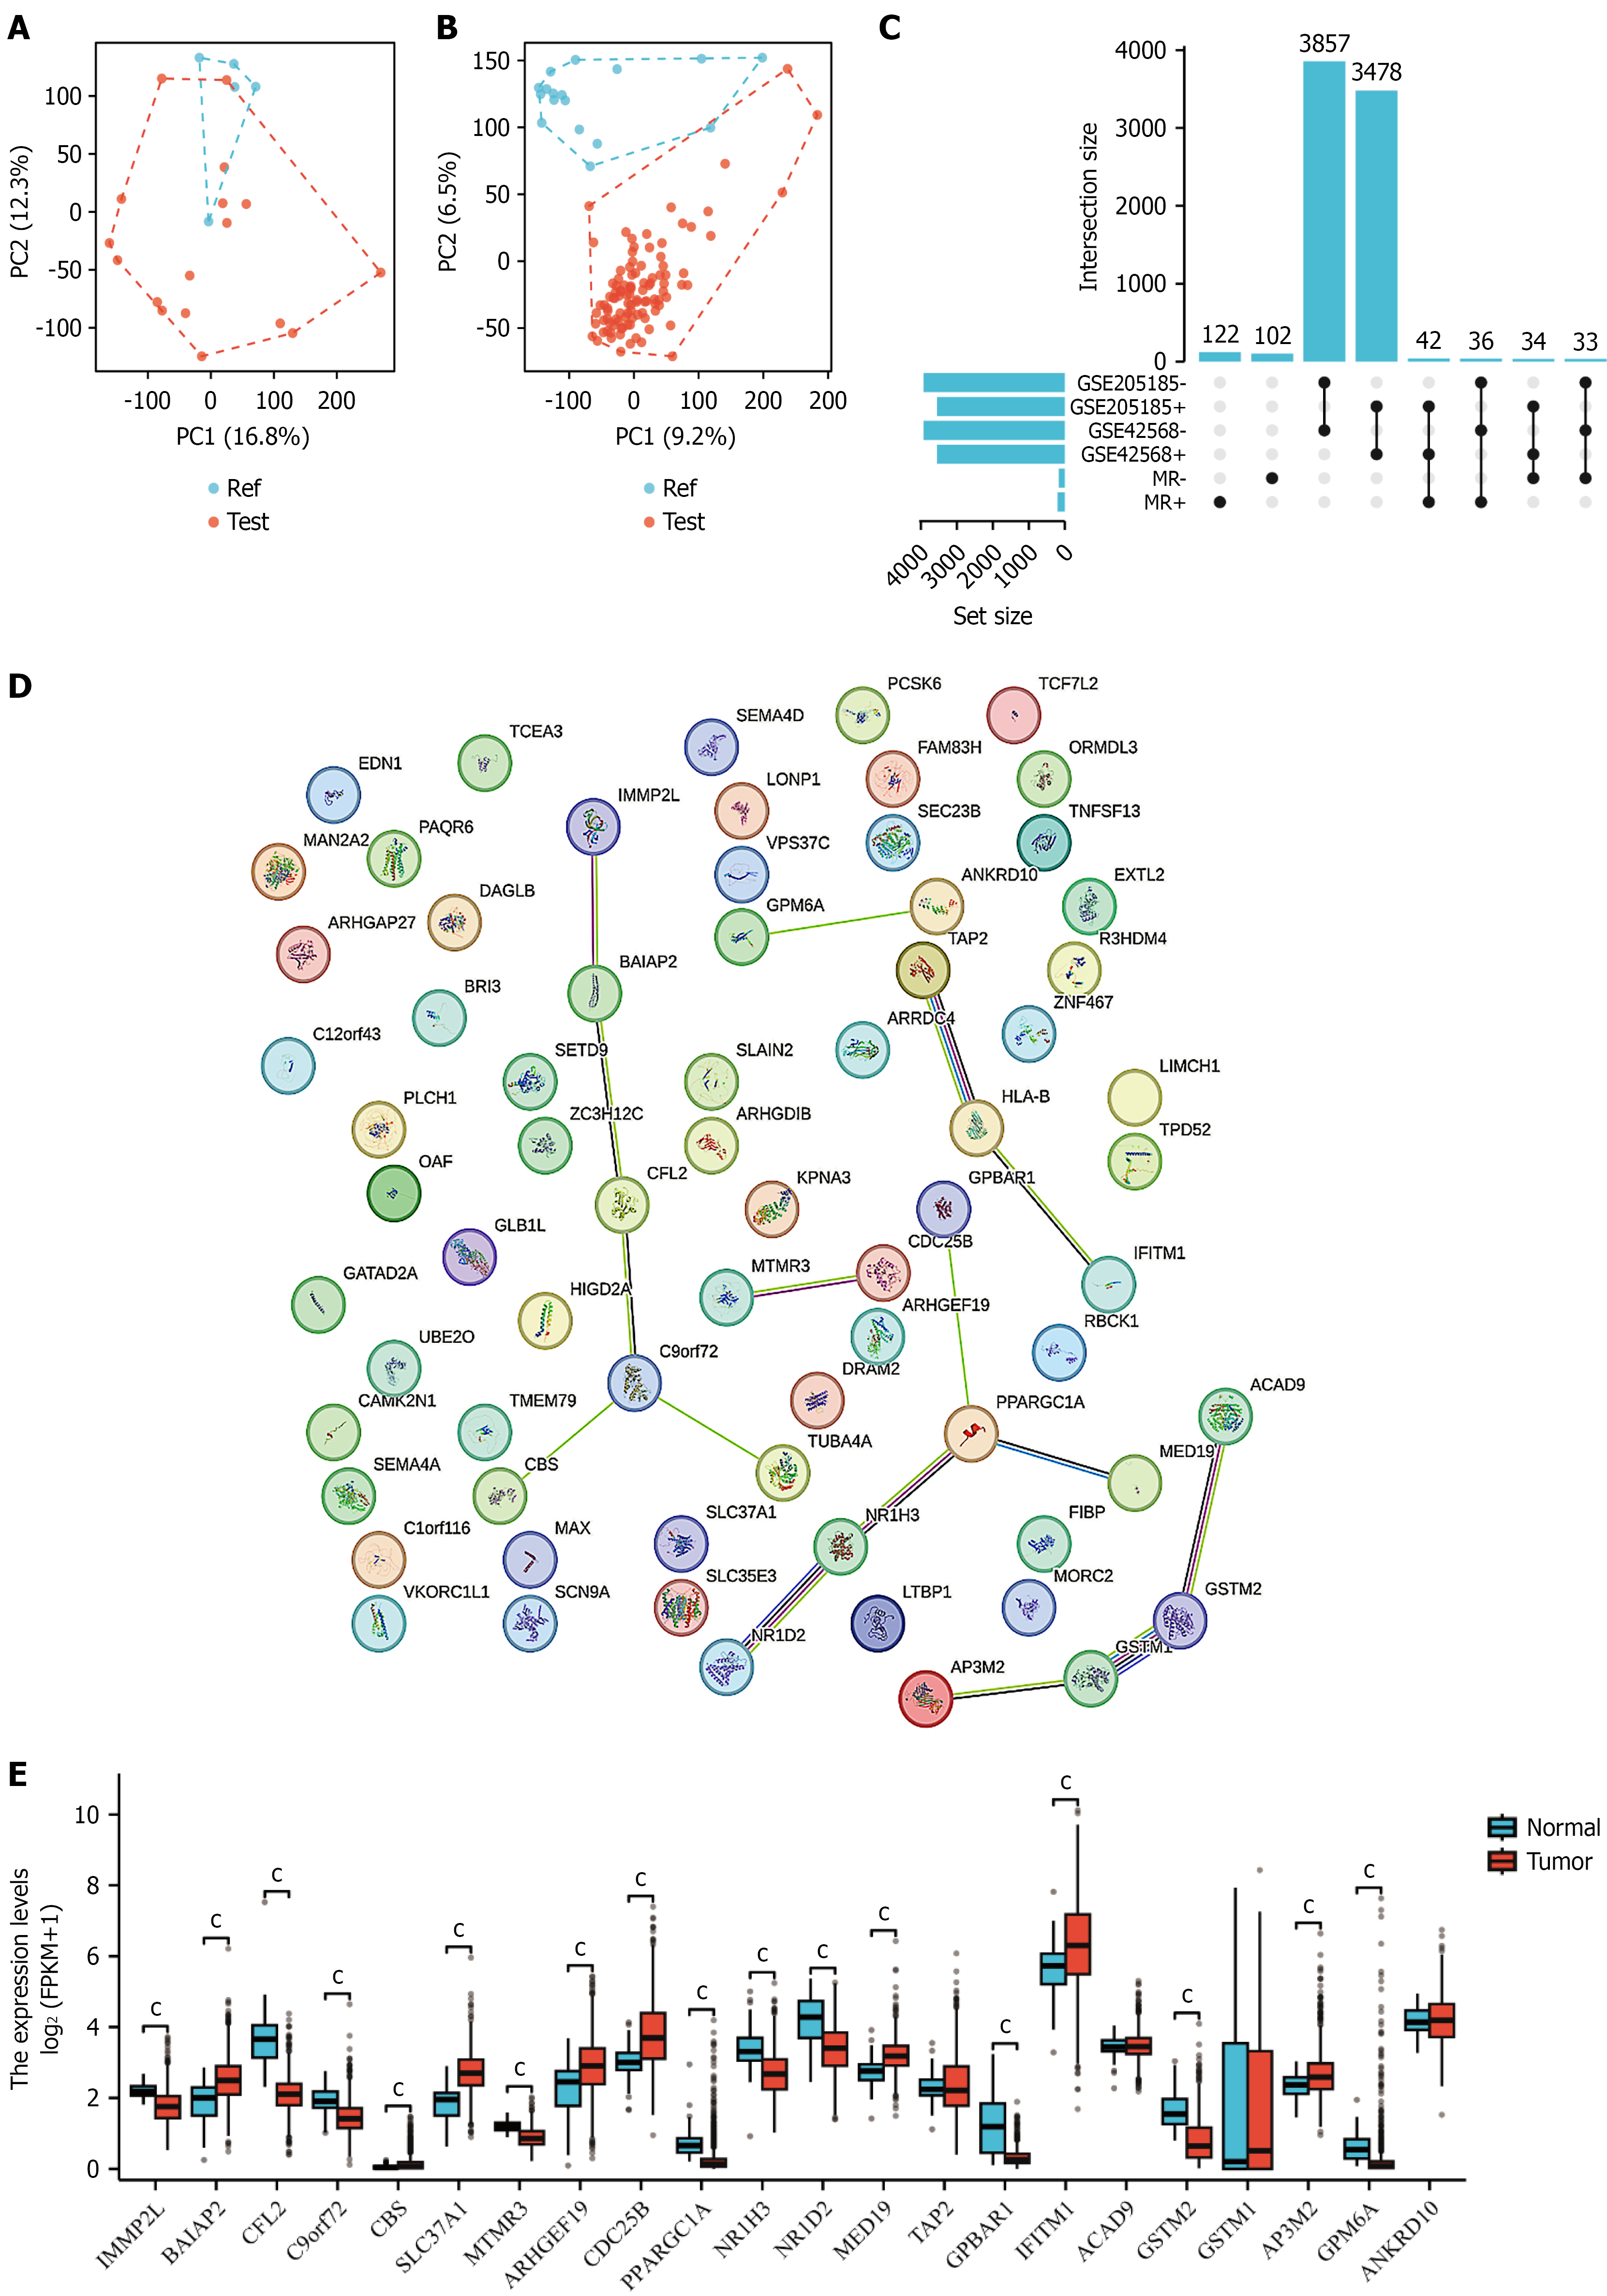
Figure 2 Transcriptomic characterization of breast cancer stem cells.
A and B: Principal component analysis plots showing distinct clustering of breast cancer stem cell samples (blue) and control samples (red) based on gene expression profiles. PC1 and PC2 explain 16.8% and 9.2% of variance, respectively; C: Differential gene expression analysis revealing 3837 significantly altered genes (1478 upregulated, 2359 downregulated) with corresponding heatmap showing expression patterns; D: Protein-protein interaction network of differentially expressed genes displaying functional associations and key regulatory nodes; E: Expression levels of stem cell-related genes in normal tissues vs breast cancer tissues, showing statistical significance (cP < 0.001).
- Citation: Guo DY, Liu ZY, Yi QC. Breast cancer stem cell activity driven by ME18D gene expression in the tumor microenvironment. World J Stem Cells 2026; 18(1): 111348
- URL: https://www.wjgnet.com/1948-0210/full/v18/i1/111348.htm
- DOI: https://dx.doi.org/10.4252/wjsc.v18.i1.111348