
















©The Author(s) 2026.
World J Stem Cells. Jan 26, 2026; 18(1): 111348
Published online Jan 26, 2026. doi: 10.4252/wjsc.v18.i1.111348
Published online Jan 26, 2026. doi: 10.4252/wjsc.v18.i1.111348
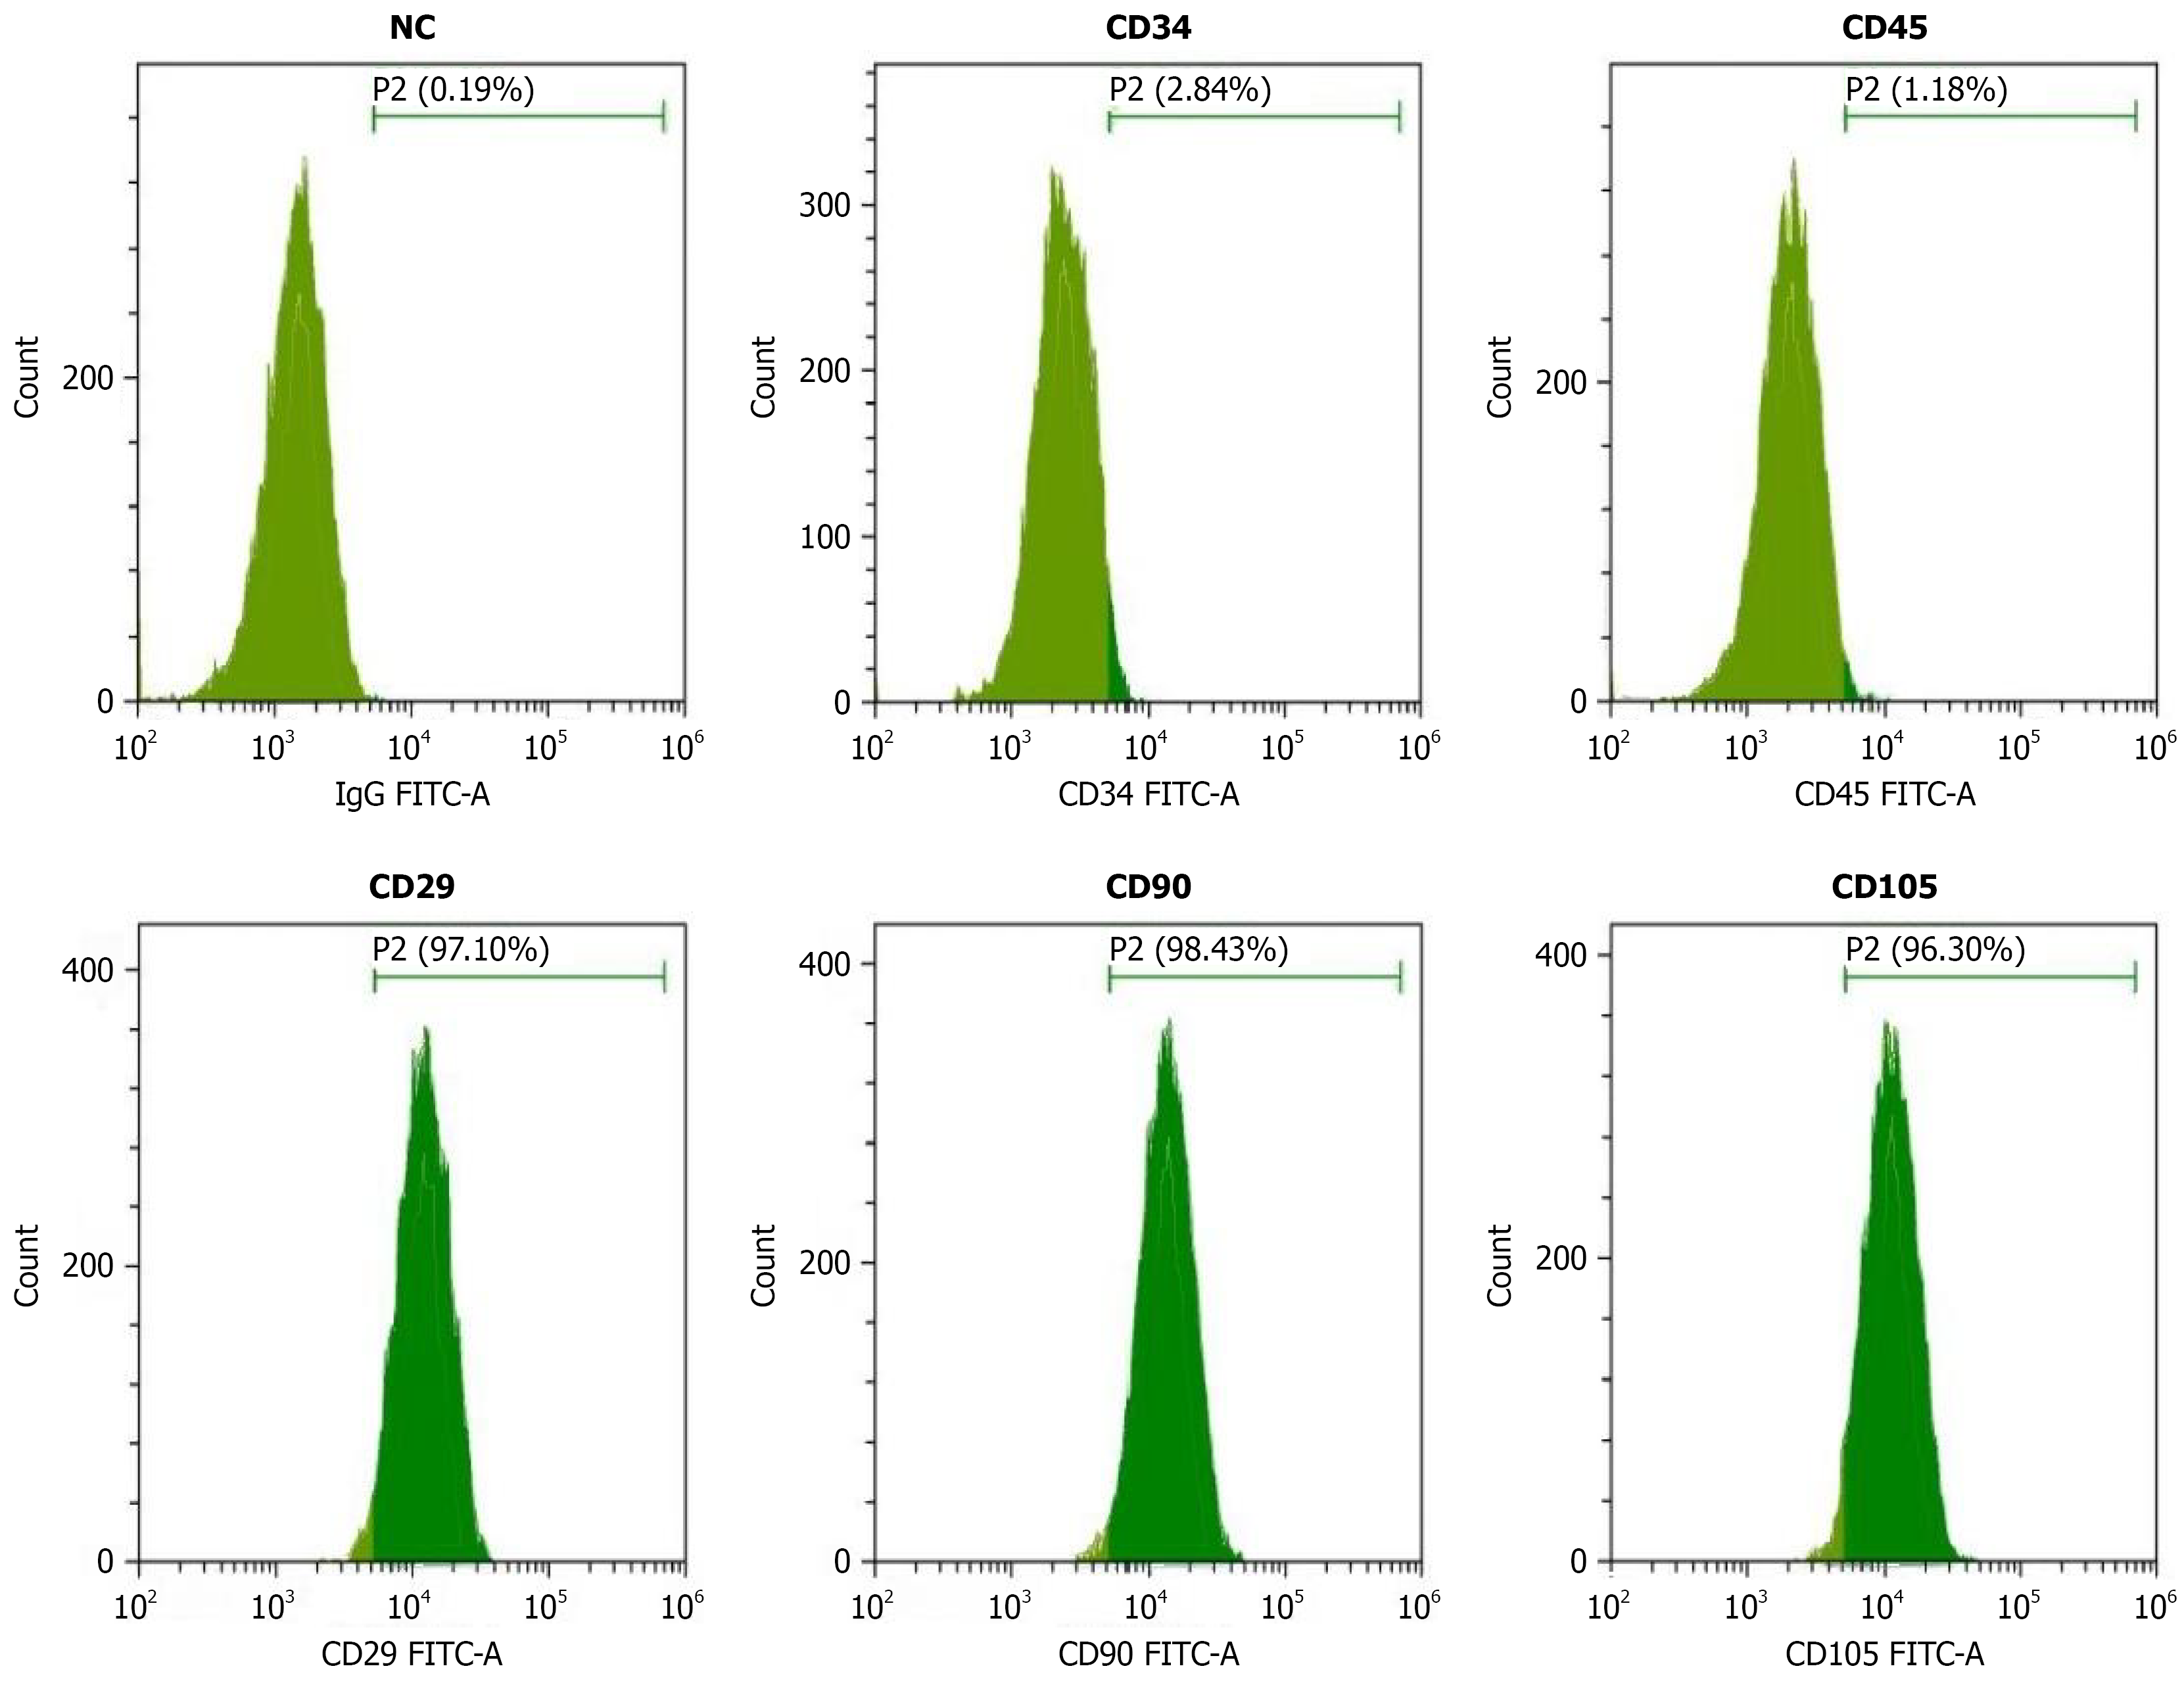
Figure 1 Flow cytometric analysis of breast cancer stem cell surface markers.
Flow cytometry histograms showing the expression of stem cell markers in breast cancer cells. Negative control (0.19% positive), CD34 (62.64% positive), CD45 (1.19% positive), CD29 (7.16% positive), CD90 (68.43% positive), and CD105 (96.30% positive). X-axis represents fluorescence intensity, Y-axis represents cell count. Percentage values indicate the proportion of positive cells for each marker, demonstrating distinct expression patterns of stem cell-associated surface antigens. NC: Negative control.
- Citation: Guo DY, Liu ZY, Yi QC. Breast cancer stem cell activity driven by ME18D gene expression in the tumor microenvironment. World J Stem Cells 2026; 18(1): 111348
- URL: https://www.wjgnet.com/1948-0210/full/v18/i1/111348.htm
- DOI: https://dx.doi.org/10.4252/wjsc.v18.i1.111348