
















©The Author(s) 2025.
World J Stem Cells. Sep 26, 2025; 17(9): 109330
Published online Sep 26, 2025. doi: 10.4252/wjsc.v17.i9.109330
Published online Sep 26, 2025. doi: 10.4252/wjsc.v17.i9.109330
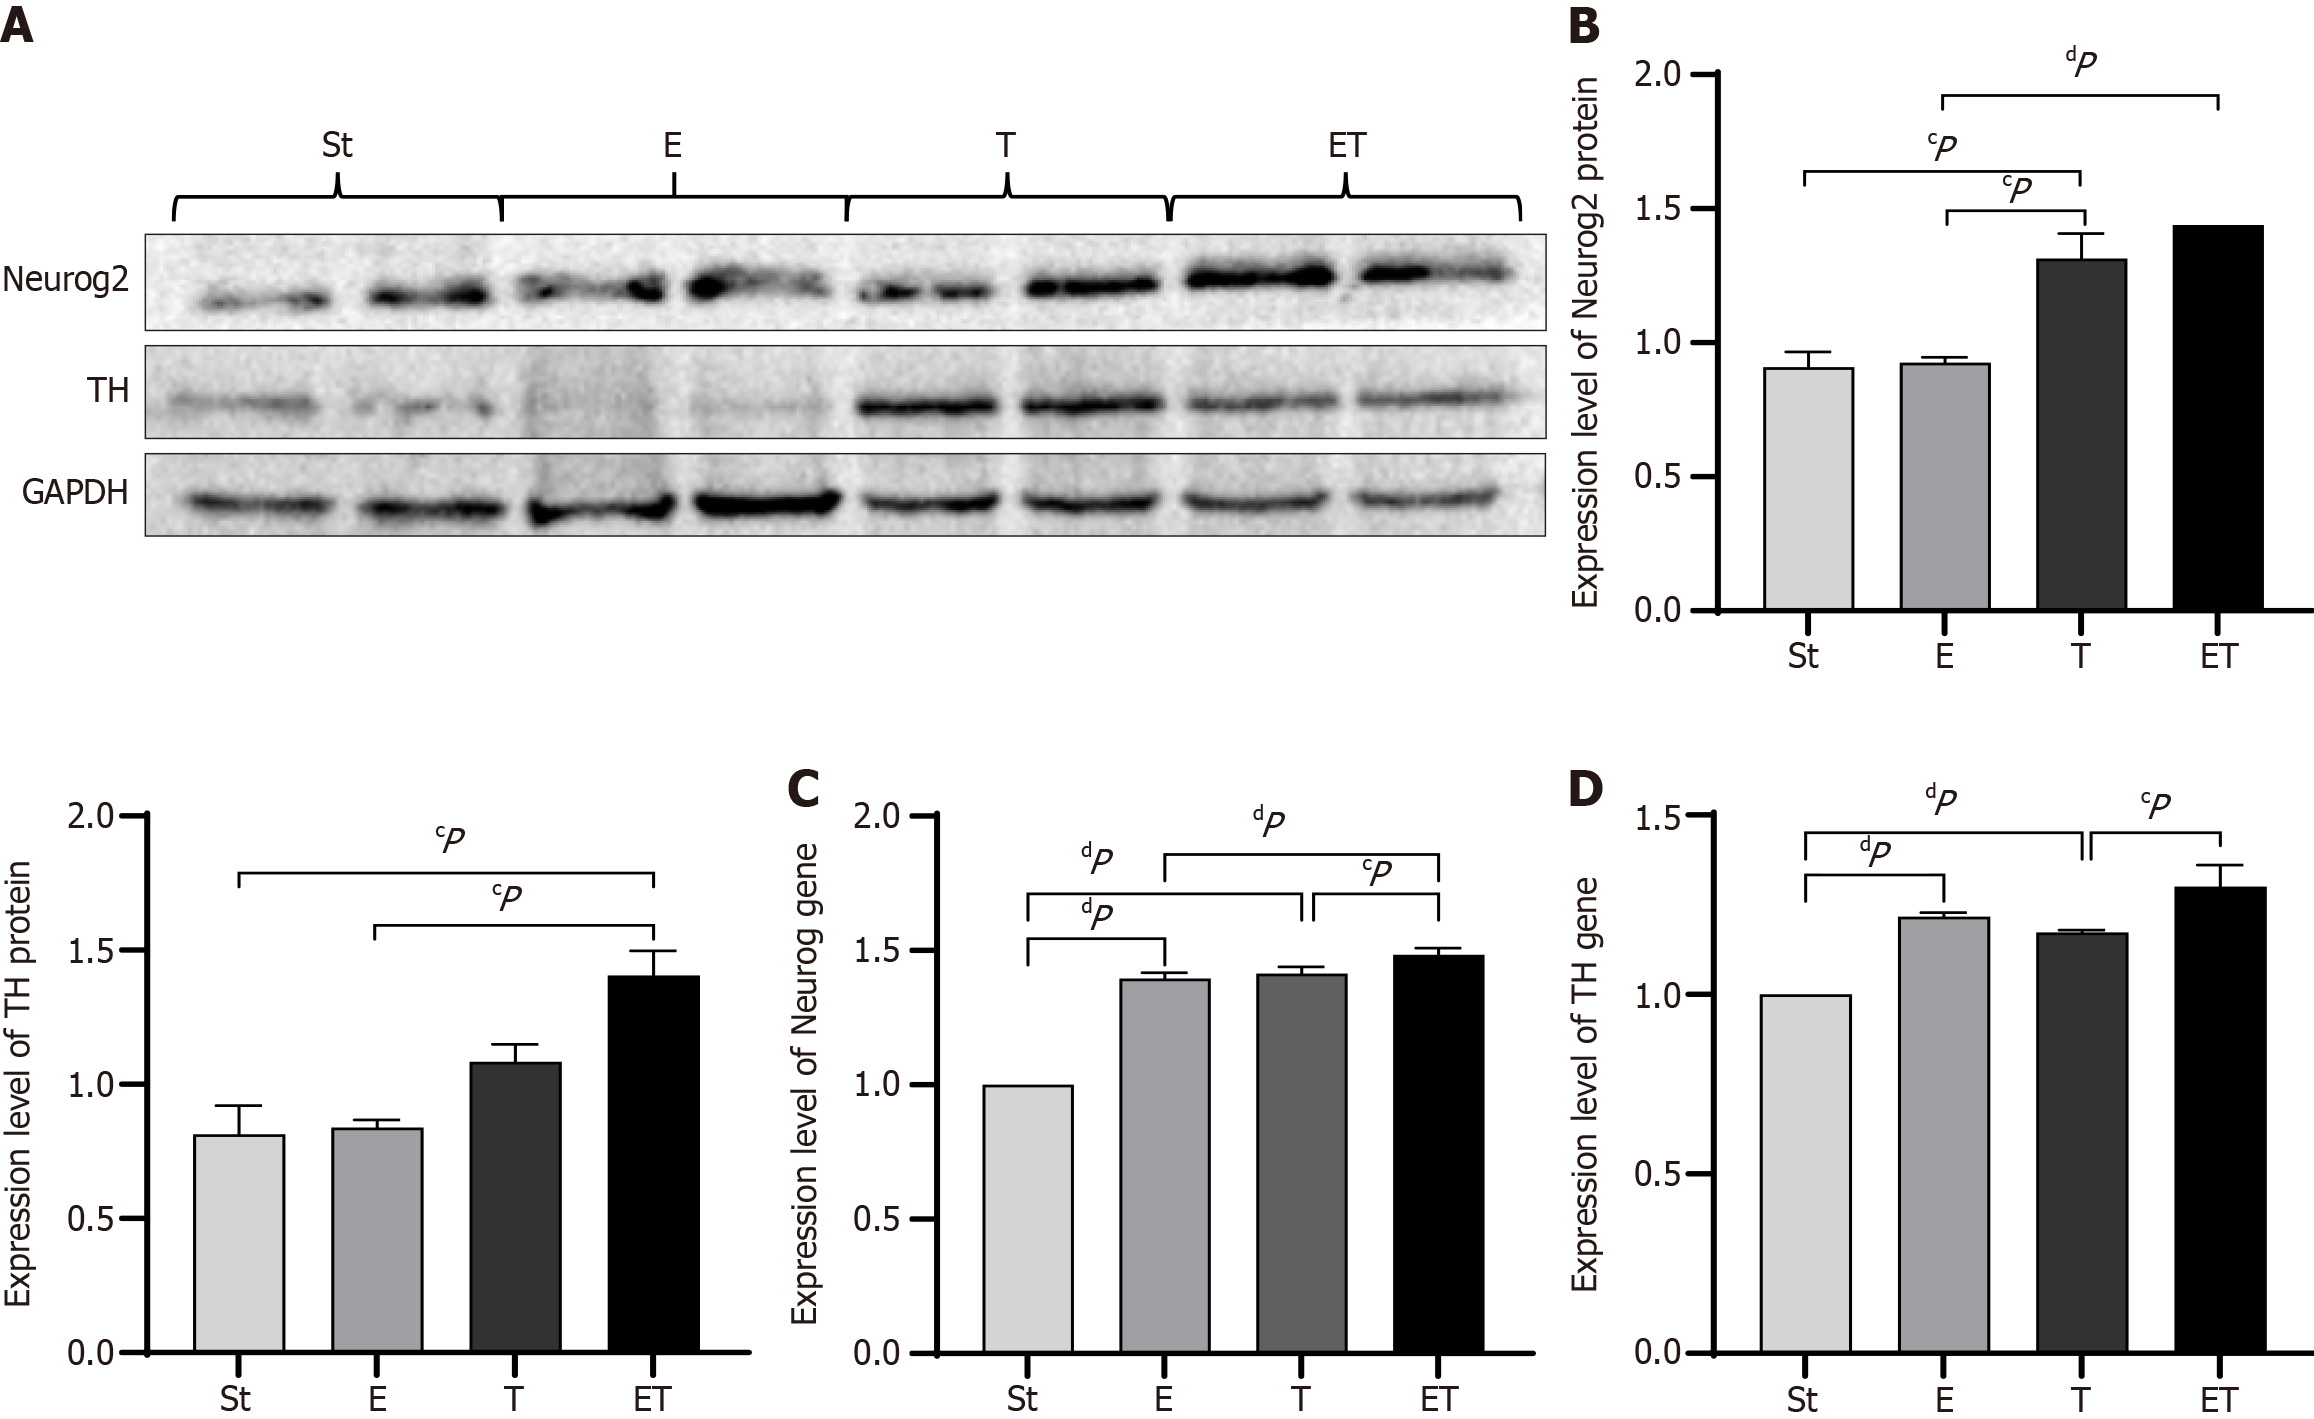
Figure 5 Expression of Neurog2 and TH in the midbrain of mice in each group.
A: The results of western blot detection of Neurog2 and TH in the midbrain of mice in each group; B: Statistical analysis of western blot results for Neurog2 and TH in the midbrain of mice in each group; C: Reverse transcription polymerase chain reaction analysis results for Neurog2 in the midbrain of mice in each group; D: Reverse transcription polymerase chain reaction analysis results for TH in the midbrain of mice in each group. cP < 0.05; dP < 0.01. St: Sedentary Parkinson’s disease group; E: Exercise Parkinson’s disease group; T: Induced pluripotent stem cell-treated Parkinson’s disease group; ET: Exercise and induced pluripotent stem cell-treated Parkinson’s disease group.
- Citation: Jiang X, Lu ZM, Wang QL, Luo Y, Zhang J. Exercise combined with induced pluripotent stem cells enhances the Wnt1-Lmx1a loop in the midbrain of Parkinsonian mice to alleviate Parkinsonian symptoms. World J Stem Cells 2025; 17(9): 109330
- URL: https://www.wjgnet.com/1948-0210/full/v17/i9/109330.htm
- DOI: https://dx.doi.org/10.4252/wjsc.v17.i9.109330