
















©The Author(s) 2025.
World J Stem Cells. Sep 26, 2025; 17(9): 105896
Published online Sep 26, 2025. doi: 10.4252/wjsc.v17.i9.105896
Published online Sep 26, 2025. doi: 10.4252/wjsc.v17.i9.105896
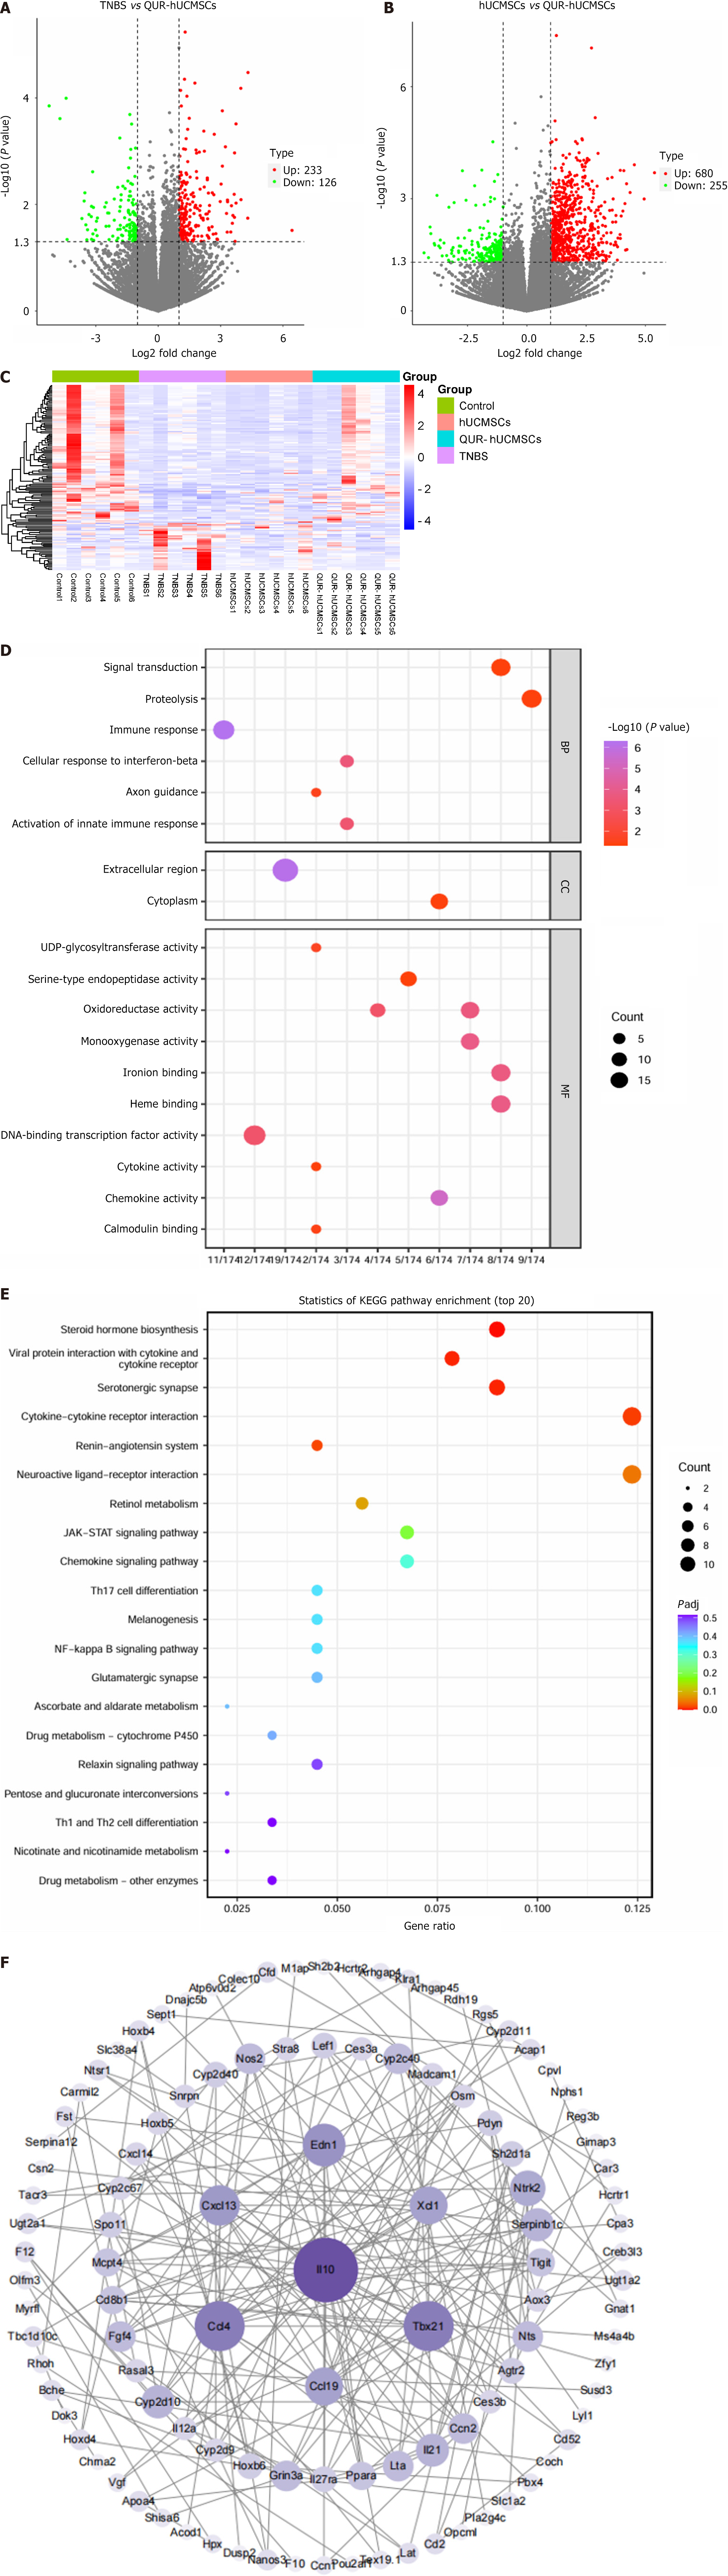
Figure 5 Colon tissue RNA sequencing: Transcriptomic analysis of colon tissue in an acute colitis model to investigate differential gene expression at transcriptional levels.
A: Differentially gene expression (DEG) volcano map. 2,4,6-trinitrobenzenesulfonic acid (TNBS) vs quercetin (QUR)-human umbilical cord-derived mesenchymal stem cells (hUCMSCs); B: DEG volcano map. hUCMSCs vs QUR-hUCMSCs. The red dots represent upregulated genes, whereas the green dots represent downregulated genes; C: Hierarchical clustering analysis of DEGs; D: Gene Ontology enrichment analysis. The -log10(P-value) is used to measure the expression of DEGs; E: Kyoto Encyclopedia of Genes and Genomes (KEGG) enrichment pathway. Point size indicates the number of genes in the pathway, and the point color corresponds to P-adjusted ranges; F: Protein network interaction analysis. Nodes represent proteins, and the connections between nodes represent the strength of protein-protein interactions. Target symbol size was related to the degree value; among them, the larger the target’s shape, the more critical the target in the network. BP: Biological processes; CC: Cellular component; JAK: Janus kinase; MF: Molecular function; STAT: Signal transducer and activator of transcription; Th17: T helper type 17.
- Citation: Shi MY, Liu L, Yang FY. Quercetin pretreated umbilical cord mesenchymal stem cells alleviate inflammatory bowel disease via IL-10 /Janus kinase 2/STAT3 signaling. World J Stem Cells 2025; 17(9): 105896
- URL: https://www.wjgnet.com/1948-0210/full/v17/i9/105896.htm
- DOI: https://dx.doi.org/10.4252/wjsc.v17.i9.105896