Copyright
©The Author(s) 2025.
World J Stem Cells. Jul 26, 2025; 17(7): 104607
Published online Jul 26, 2025. doi: 10.4252/wjsc.v17.i7.104607
Published online Jul 26, 2025. doi: 10.4252/wjsc.v17.i7.104607
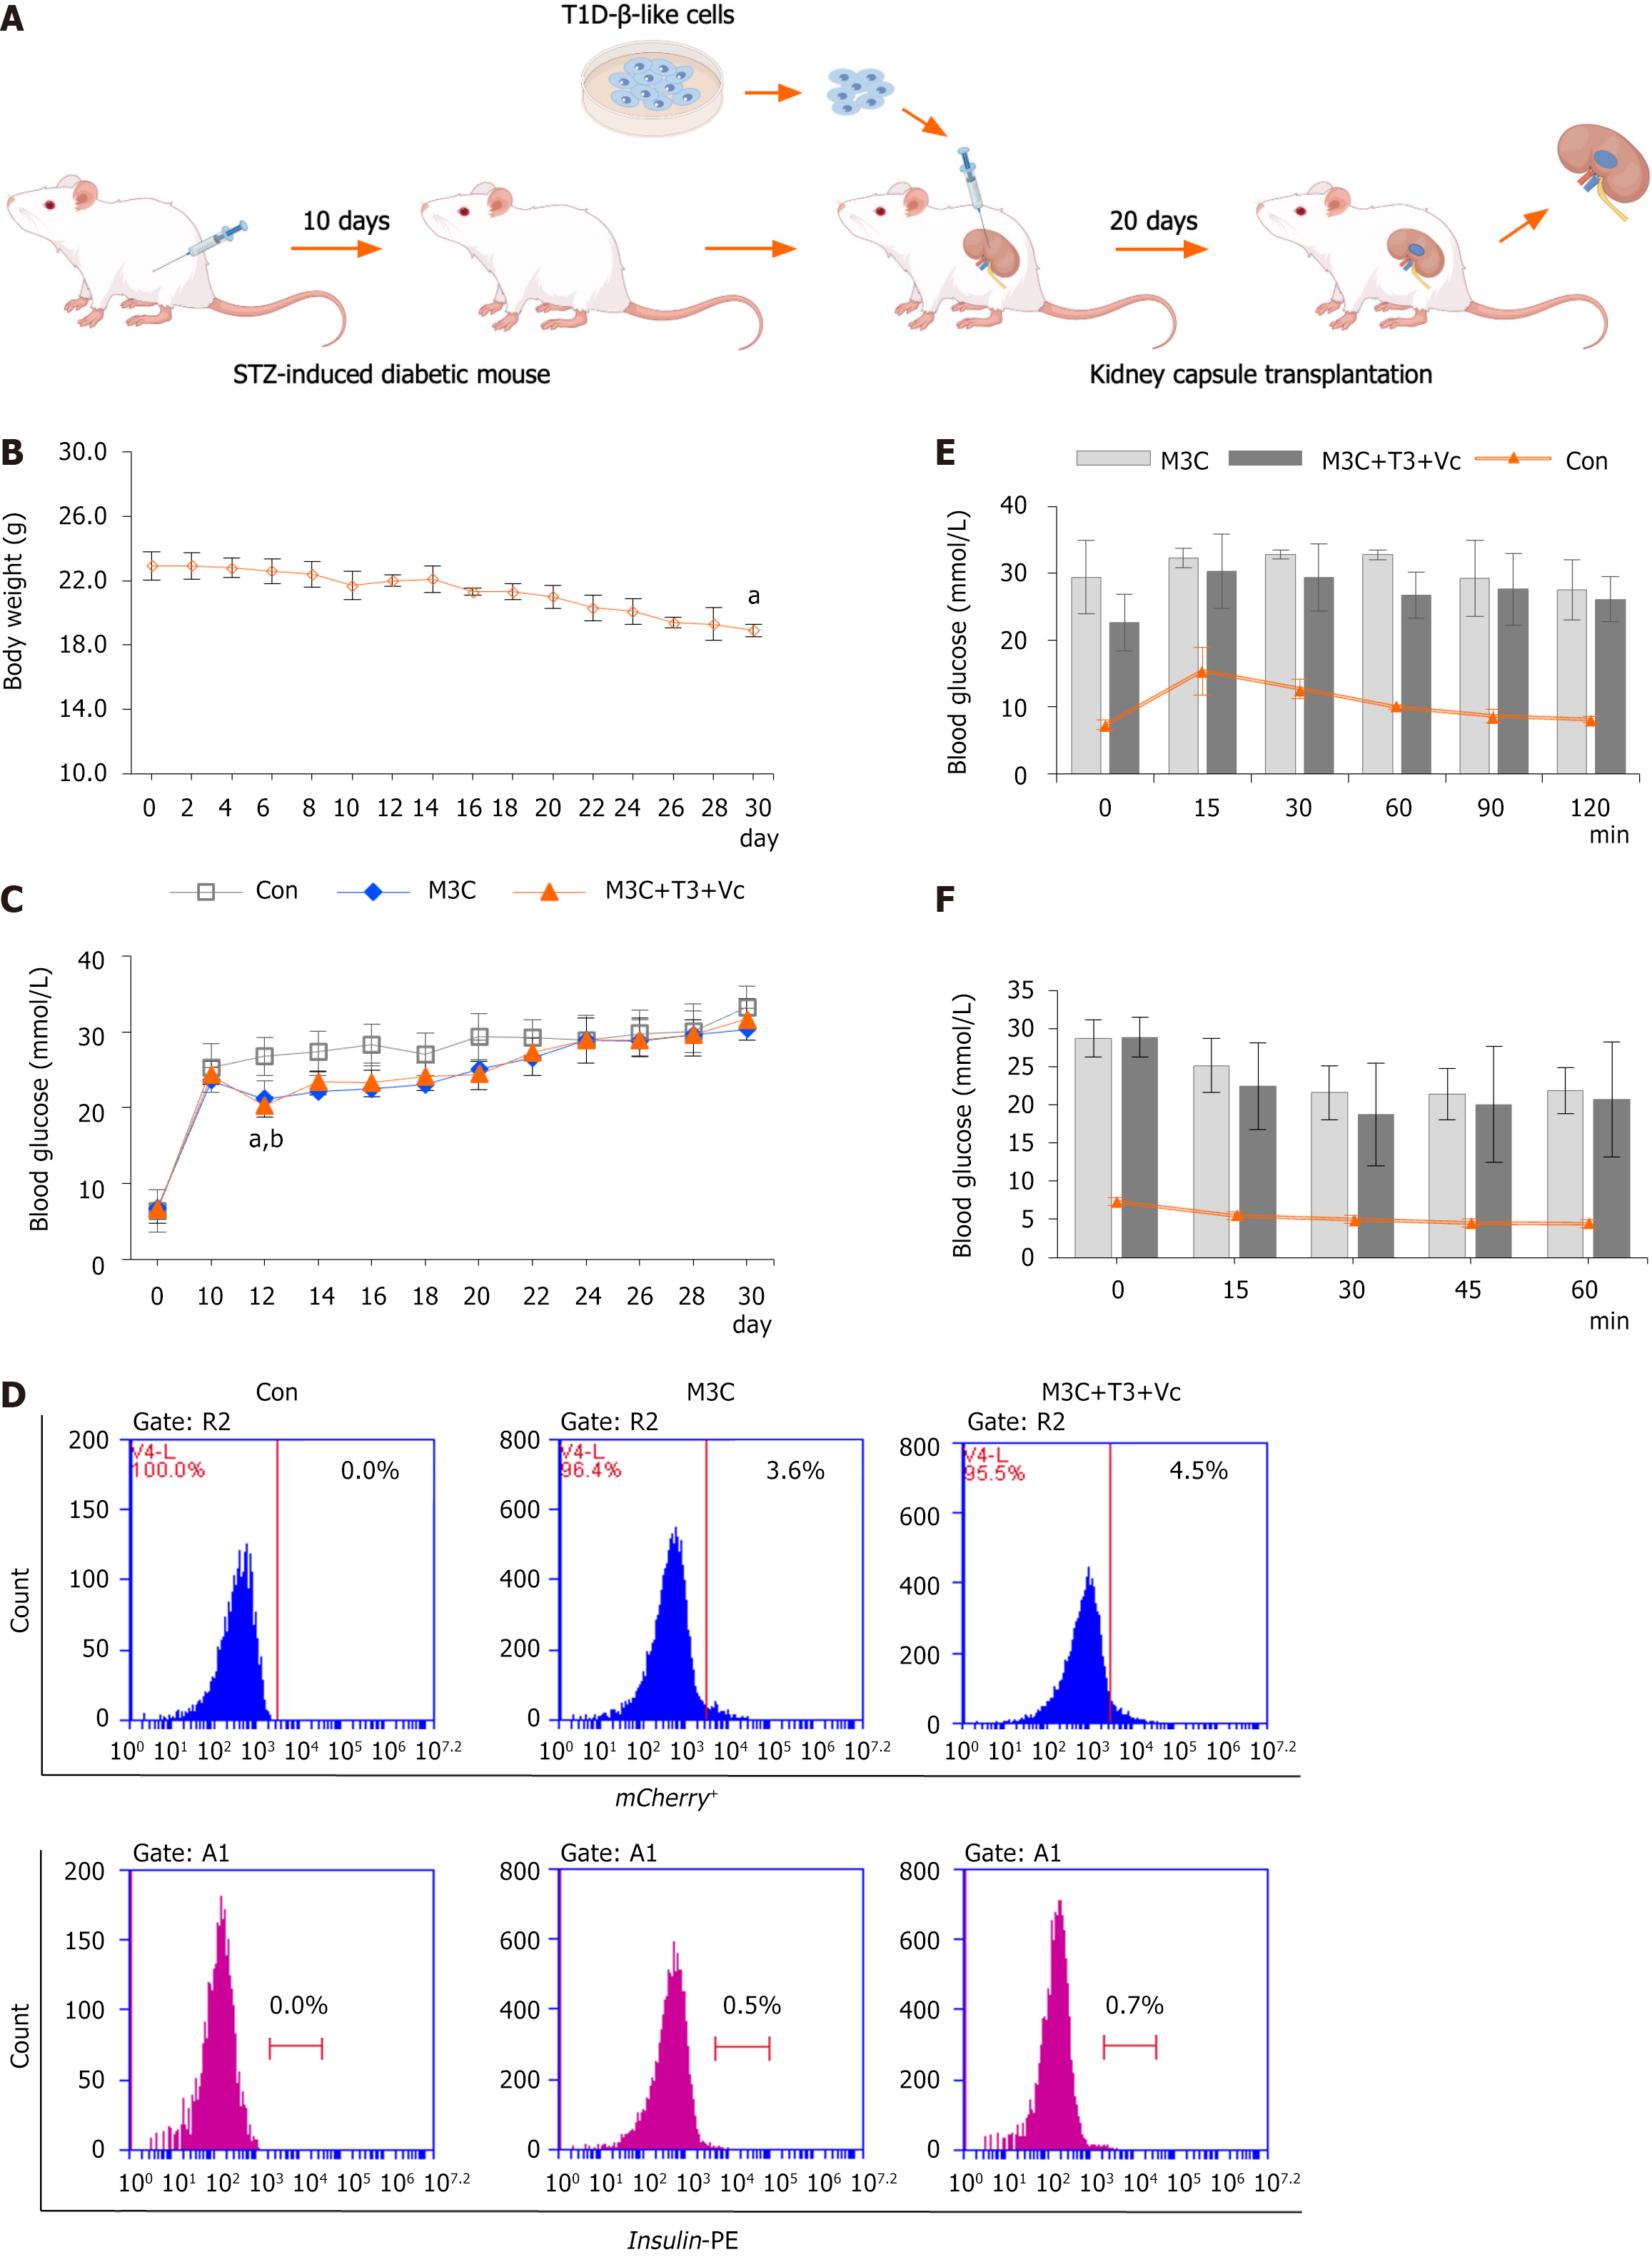
Figure 4 Regulation of hyperglycemia by type 1 diabetes-β-like cells in diabetic mice.
A: Schematic of renal subcapsular transplantation. Schematic representation of the process involved in subcapsular kidney transplantation of type 1 diabetes (T1D)-β-like cells aimed at regulating blood glucose levels in streptozotocin-induced diabetic mice; B: Longitudinal body weight monitoring. Body weight measurements in streptozotocin-induced diabetic mice demonstrated a gradual decline starting from the onset of the experiment, continuing throughout the entire 30-day duration until study completion (n = 15, 18.90 ± 0.40 vs 22.9 ± 0.89, aP < 0.01); C: Random blood glucose profiles. Random blood glucose assessments in the tail vein of mice from each diabetic group (n = 5 samples per group) showed that following transplantation of T1D-β-like cells under the renal capsule (performed on day 10 post-modeling), blood glucose levels in the M3C and M3C + triiodothyronine (T3) + vitamin C (Vc) groups decreased significantly over 2 days, compared to the control (21.16 ± 2.13 vs 26.8 ± 2.51; 20.3 ± 1.50 vs 26.8 ± 2.51; aP < 0.01, bP < 0.01, M3C and M3C + T3 + Vc group compared with the control group, respectively). However, glucose levels rose again and stabilized at high levels, with no statistically significant differences relative to the control group; D: Flow cytometry analysis of grafted cells. Flow cytometry results indicated an increase in the percentages of insulin+ (0.5%, 0.7%) and mCherry+ (3.8%, 4.5%) cells compared to isotype-negative controls 20 days post-transplantation, though no significant difference was noted between the M3C and M3C + T3 + Vc groups; E: Intraperitoneal glucose tolerance test. Intraperitoneal glucose tolerance test (n = 5 samples per group), M3C and M3C + T3 + Vc groups initially registered high blood glucose levels which peaked at 15 minutes, subsequently decreasing at the 60th and 90th minutes. In contrast, blood glucose in the control group began to decrease post 15 minutes, but no significant differences were observed between the M3C and M3C + T3 + Vc groups; F: Insulin tolerance test in transplanted mice. Insulin tolerance test (n = 5 samples per group), post-intraperitoneal insulin injections, blood glucose levels in the tails of M3C and M3C + T3 + Vc mice reached their lowest at the 30-minute mark before rising again. This pattern was consistent in the control group, where levels also decreased after 15 minutes, with no significant differences between the M3C and M3C + T3 + Vc groups. T1D: Type 1 diabetes; STZ: Streptozotocin; T3: Triiodothyronine; Vc: Vitamin C.
- Citation: Wang K, Lin W, Han JY, Chen JY, Liu RH, Yu Z, Jin JJ. Differentiation of patient-specific induced pluripotent stem cells derived from type 1 diabetes peripheral blood mononuclear cells into pancreatic β-like cells. World J Stem Cells 2025; 17(7): 104607
- URL: https://www.wjgnet.com/1948-0210/full/v17/i7/104607.htm
- DOI: https://dx.doi.org/10.4252/wjsc.v17.i7.104607


