Copyright
©The Author(s) 2025.
World J Stem Cells. Jul 26, 2025; 17(7): 104607
Published online Jul 26, 2025. doi: 10.4252/wjsc.v17.i7.104607
Published online Jul 26, 2025. doi: 10.4252/wjsc.v17.i7.104607
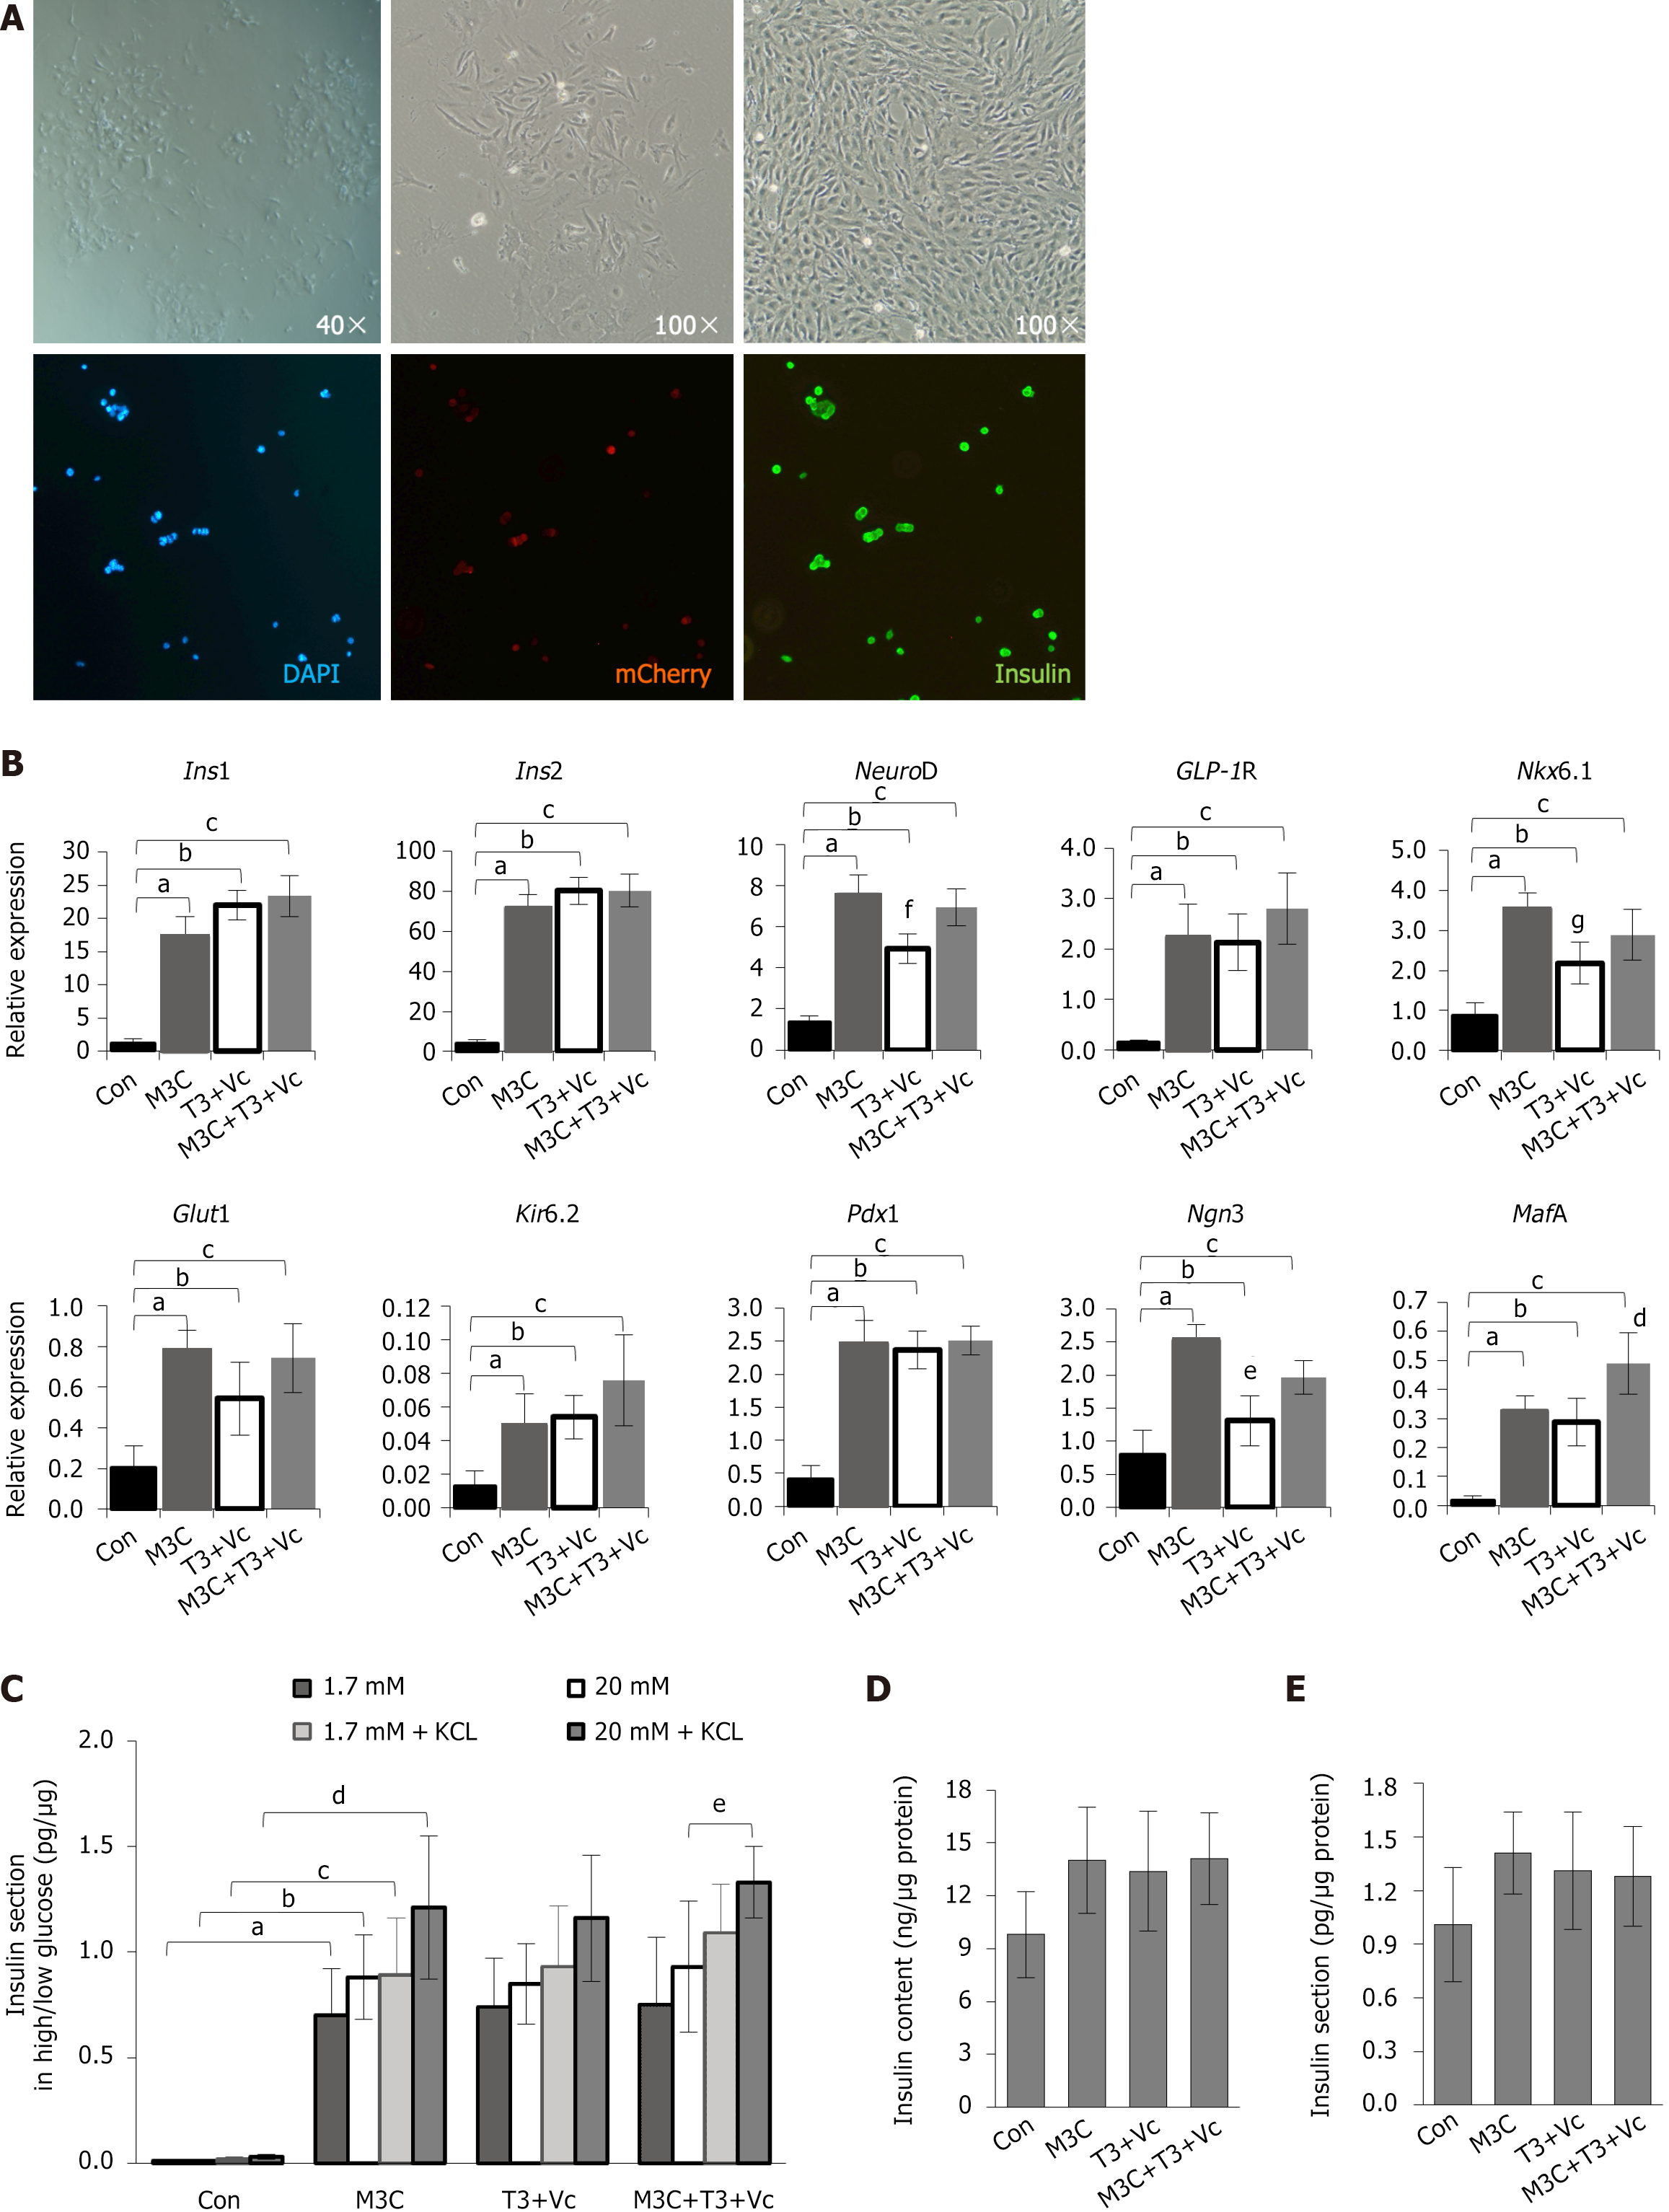
Figure 3 Characterization of type 1 diabetes-β-like cells: Morphology, molecular marker expression, and insulin secretion function.
A: Morphological and phenotypic analysis of differentiated cells. Type 1 diabetes (T1D)-induced pluripotent stem cells were induced to differentiate into T1D-β-like cells in vitro. Before induction, the adherent cells displayed clonal growth and transitioned into spindle- or rod-shaped monolayers. Post-induction, these cells exhibited a distinct oval, stone-like appearance, differing in size and shape from mature pancreatic β-cells. Immunofluorescence staining confirmed the co-expression of mCherry+ (red) and insulin+ (green) in these cells, indicating the presence of both markers; B: The quantitative real-time polymerase chain reaction analysis of β-cell marker expression. The expression of β-cell markers (insulin 1, insulin 2, NeuroD, glucagon-like peptide-1 receptor, Nkx6.1, glucose transporter 2, Kir62, pancreatic duodenal homeobox-1, neurogenin 3, and MAF bZIP transcription factor A) was significantly elevated in M3C, triiodothyronine (T3) + vitamin C (Vc), and M3C + T3 + Vc groups compared to that in undifferentiated T1D-induced pluripotent stem cells (blank control). Data are expressed as mean ± SD (n = 3 samples per group). Statistical significance was assessed using Student’s t-test (insulin 1, aP < 0.01, bP < 0.01, cP < 0.01; insulin 2, aP < 0.01, bP < 0.01, cP < 0.01; NeuroD, aP < 0.01, bP < 0.01, cP < 0.01, fP < 0.05, T3 + Vc group compared with other three experimental groups; GLP1R, aP < 0.01, bP < 0.01, cP < 0.01; Nkx6.1, aP < 0.01, bP < 0.01, cP < 0.01, gP < 0.05, T3 + Vc group compared with other three experimental groups; Glut2, aP < 0.01, bP < 0.01, cP < 0.01; Kir6.2, aP < 0.01, bP < 0.01, cP < 0.01; Pdx1, aP < 0.01, bP < 0.01, cP < 0.01; Ngn3, aP < 0.01, bP < 0.05, cP < 0.05, eP < 0.01, T3 + Vc group compared with other three experimental groups; MafA, aP < 0.01, bP < 0.01, cP < 0.01, dP < 0.05, M3C + T3 + Vc group compared with other three experimental groups); C: Glucose-stimulated insulin secretion. Glucose-stimulated insulin secretion was assessed using total protein (μg) levels in parallel wells as a standard. Insulin secretion (pg) elicited by 1.7 mmol/L and 20 mmol/L glucose was analyzed and expressed as a ratio (pg/μg) with mean ± SD (n = 6 samples per group). Statistical significance was determined using Student’s t-test. The results indicated that M3C, T3 + Vc, and M3C + T3 + Vc groups did not significantly respond to varying glucose concentrations (1.7 mmol/L vs 20 mmol/L), with limited increases. Insulin secretion was significantly higher in the M3C + T3 + Vc group under elevated glucose (20 mmol/L) with 30 mmol/L KCl than that in the same group without KCl (1.33 ± 0.17 vs 0.93 ± 0.31, eP < 0.05). Insulin output in all experimental groups (M3C, T3 + Vc, and M3C + T3 + Vc) was significantly greater than that of the control group under all conditions (aP < 0.01, bP < 0.01, cP < 0.01, dP < 0.01); D: Intracellular insulin content. ELISA was used to quantify the intracellular insulin content (ng) of T1D-β-like cells compared to the total protein (μg) of control cells (ng/μg). The results are expressed as mean ± SD (n = 6 samples per group), and statistical significance was assessed using Student’s t-test. No significant differences were observed in the increase in intracellular insulin content among M3C, T3 + Vc, and M3C + T3 + Vc groups; E: Basal insulin secretion. Another ELISA analyzed the insulin secretion levels (pg) from T1D-β-like cells, also reported as a ratio to total protein (μg) in control cells (pg/μg). Data are presented as mean ± SD (n = 6 samples per group), with statistical significance determined by Student’s t-test. Again, no notable differences were detected in the increase of extracellular insulin secretion across M3C, T3 + Vc, and M3C + T3 + Vc groups. Ins1: Insulin 1; Ins2: Insulin 2; GLP-1R: Glucagon-like peptide-1 receptor; Glut2: Glucose transporter 2; Pdx1: Pancreatic duodenal homeobox-1; Ngn3: Neurogenin 3; MafA: MAF bZIP transcription factor A; T3: Triiodothyronine; Vc: Vitamin C.
- Citation: Wang K, Lin W, Han JY, Chen JY, Liu RH, Yu Z, Jin JJ. Differentiation of patient-specific induced pluripotent stem cells derived from type 1 diabetes peripheral blood mononuclear cells into pancreatic β-like cells. World J Stem Cells 2025; 17(7): 104607
- URL: https://www.wjgnet.com/1948-0210/full/v17/i7/104607.htm
- DOI: https://dx.doi.org/10.4252/wjsc.v17.i7.104607


