Copyright
©The Author(s) 2025.
World J Stem Cells. Jul 26, 2025; 17(7): 104607
Published online Jul 26, 2025. doi: 10.4252/wjsc.v17.i7.104607
Published online Jul 26, 2025. doi: 10.4252/wjsc.v17.i7.104607
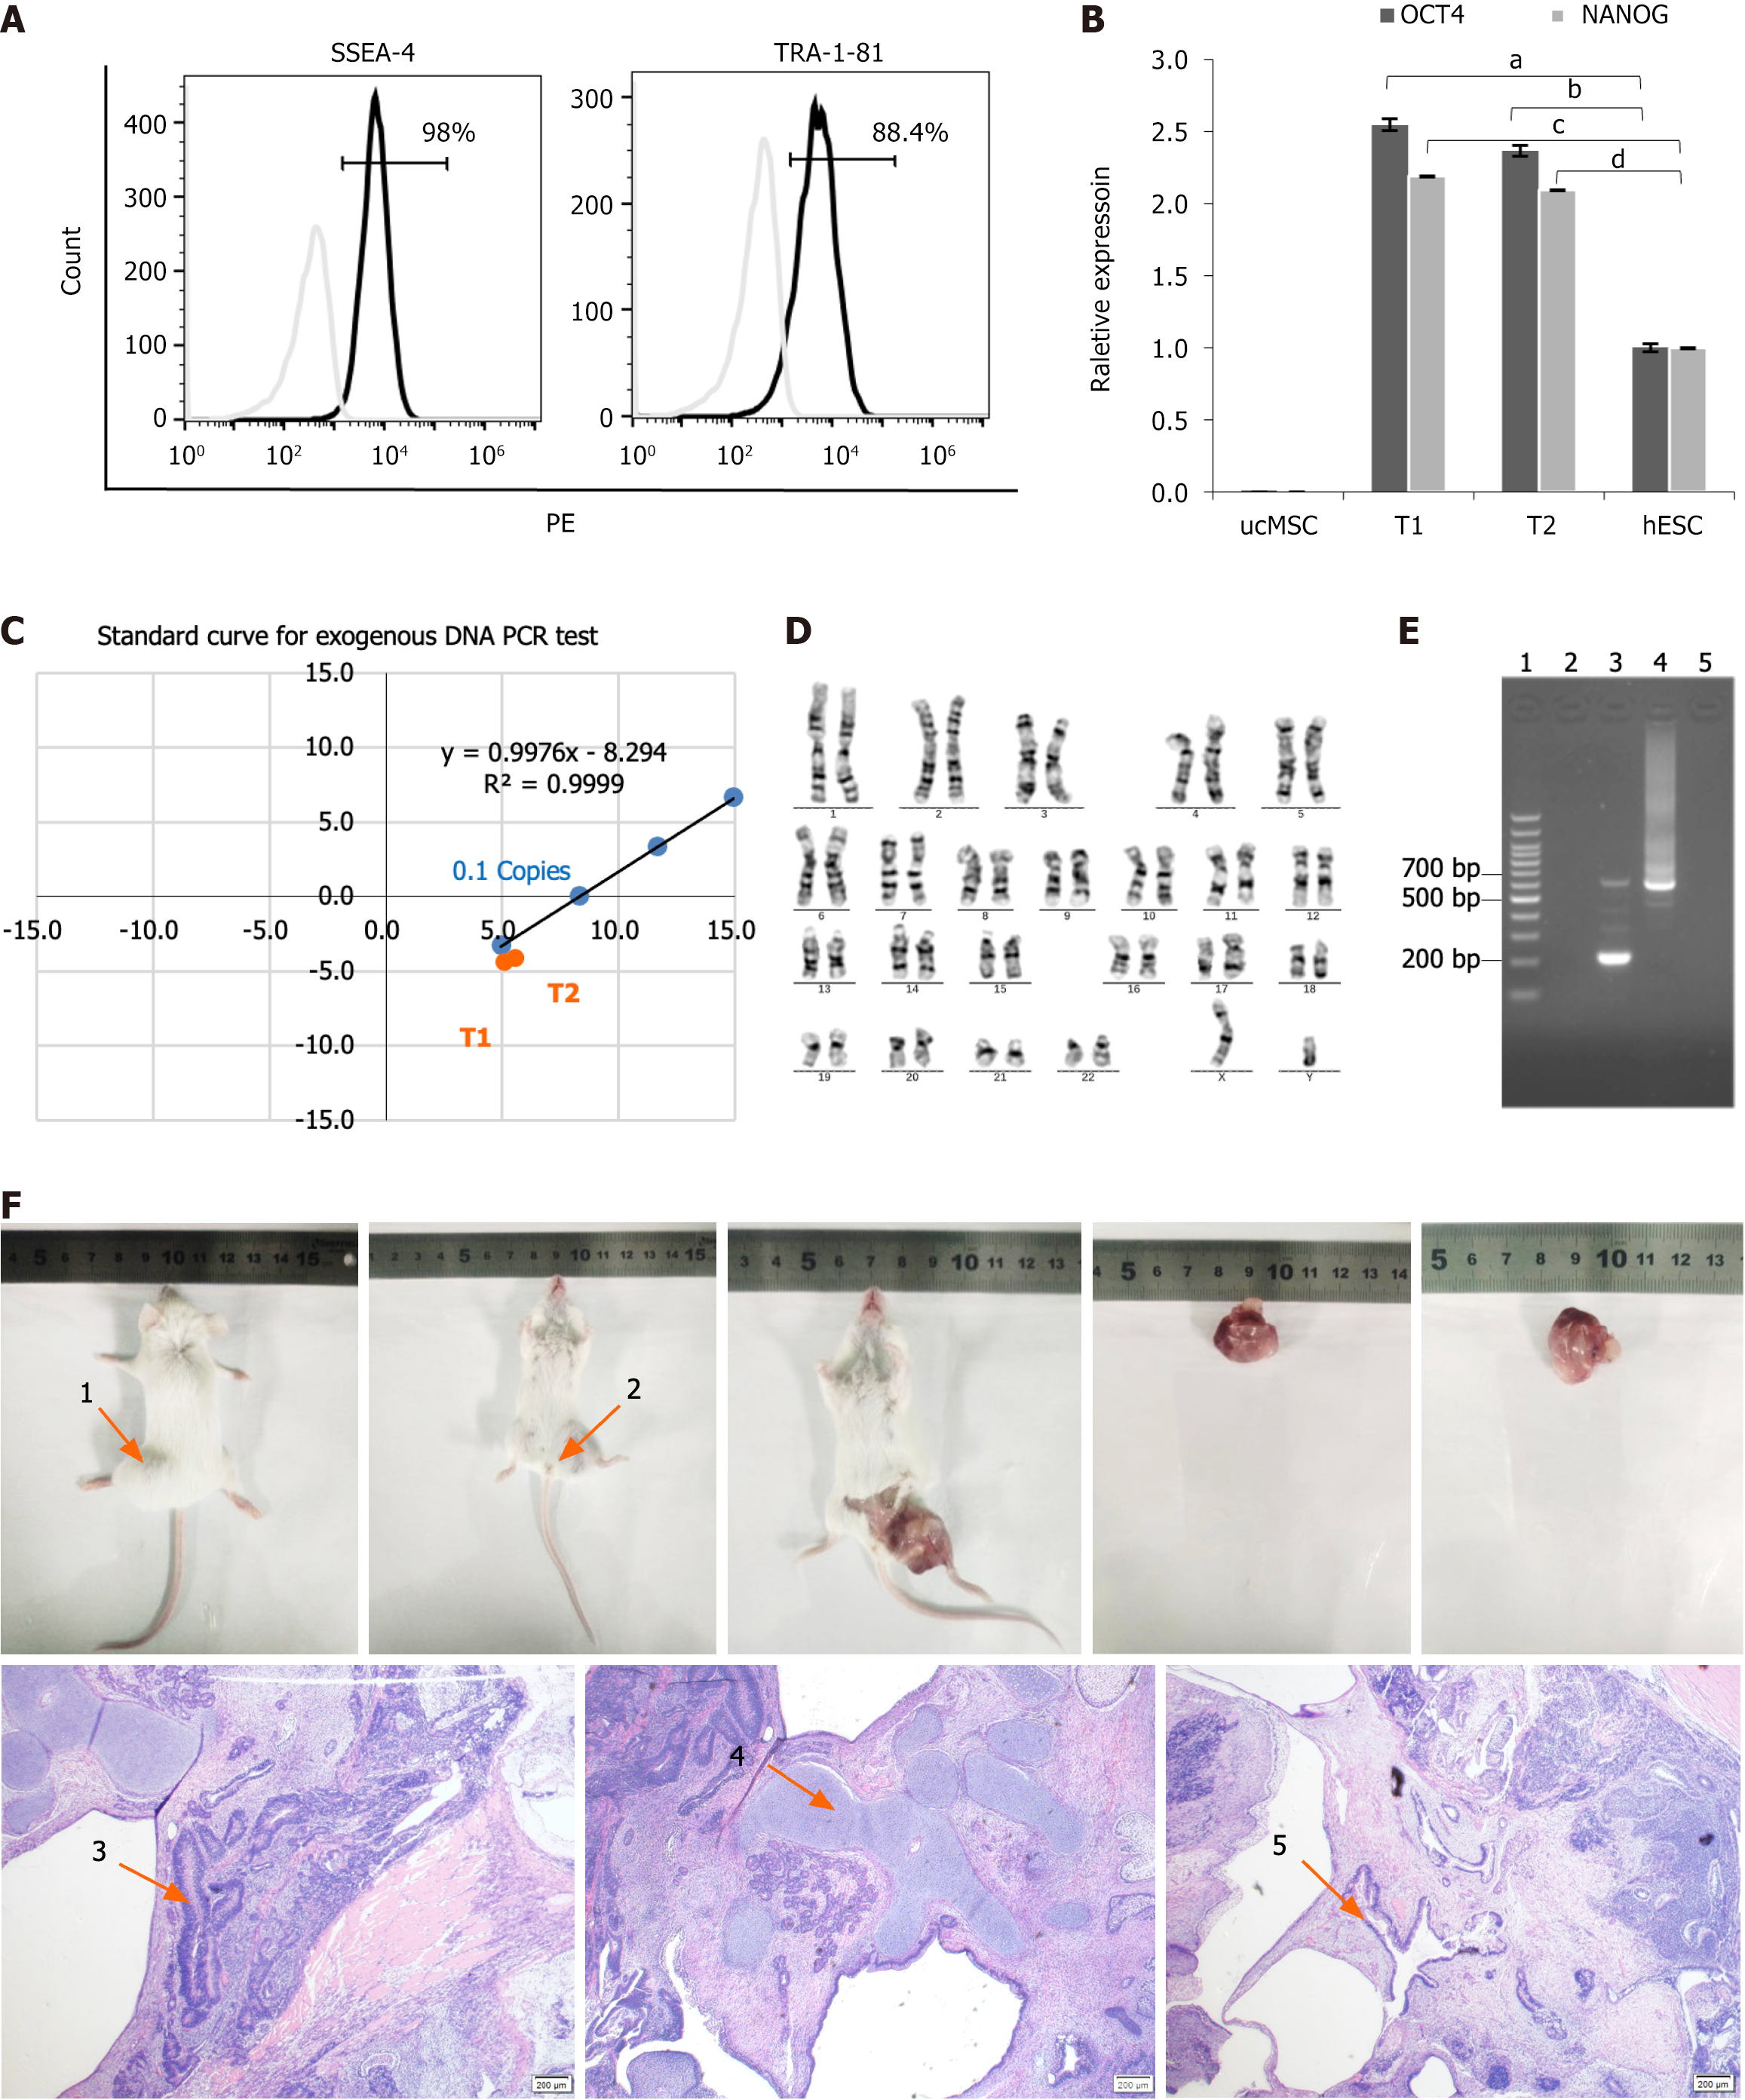
Figure 2 Comprehensive characterization of type 1 diabetes patient-derived induced pluripotent stem cells.
A: Flow cytometry analysis of pluripotency surface markers. SSEA4+/TRA-1-81+ expression levels were analyzed using flow cytometry (98% and 88.4%, respectively). Type 1 diabetes (T1D)-induced pluripotent stem cells (iPSCs) were labeled with PE-conjugated SSEA4 and TRA-1-81 antibodies; B: The quantitative real-time polymerase chain reaction (qRT-PCR) quantification of core pluripotency factors. The OCT4+/NANOG+ expression in T1D-iPSCs was quantified using qRT-PCR (human embryonic stem cell = 1), demonstrating a significant increase relative to human ESCs and umbilical cord mesenchymal stem cells (OCT4, 2.55 ± 0.04 vs 1.00 ± 0.028; aP < 0.01; 2.37 ± 0.36 vs 1.00 ± 0.028; bP < 0.01; NANOG, 2.19 ± 0.001 vs 1.00 ± 0.003, cP < 0.01; 2.09 ± 0.001 vs 1.00 ± 0.003, dP < 0.01); C: Validation of exogenous gene silencing. The absence of exogenous gene interference in T1D-iPSCs was validated using qRT-PCR of Ct values for OCT4, gEBNA1, and gOrip under an exogenous gene standard curve. The red dots indicate the positions of samples T1 and T2 within the shaded area, indicating that the Y(n) values were < 0.1 copies of Y (0.1), thus confirming the absence of exogenous genes; D: Genomic stability assessment. Chromosomal karyotyping was performed to assess the genomic stability of T1D-iPSCs, revealing 46 chromosomes with an XY composition. G-banding analysis of 20 mitotic phases confirmed a normal karyotype without numerical or structural abnormalities observed; E: Mycoplasma testing. PCR products for mycoplasma detection from T1D-iPSCs were negative, as demonstrated by gel electrophoresis, including: 1 = 100 bp plus DNA ladder; 2 = negative control; 3 = positive control (kit); 4 = positive control (infected samples); 5 = T1D-iPSCs; F: Teratoma formation assay. The teratoma formation assay indicated normal differentiation across all three germ layers. The teratomas were in the prone (arrow 1) and supine (arrow 2) positions. Microscopy (40 ×) of hematoxylin and eosin-stained sections revealed ectodermal differentiation (arrow 3), neural tissue with histiocytes; mesodermal differentiation (arrow 4), cartilage tissue with histiocytes; endodermal differentiation (arrow 5), and intestinal epithelium with histiocytes. aP < 0.01; bP < 0.01; cP < 0.01; dP < 0.01. ucMSC: Umbilical cord mesenchymal stem cell; hESC: Human embryonic stem cell; PCR: Polymerase chain reaction.
- Citation: Wang K, Lin W, Han JY, Chen JY, Liu RH, Yu Z, Jin JJ. Differentiation of patient-specific induced pluripotent stem cells derived from type 1 diabetes peripheral blood mononuclear cells into pancreatic β-like cells. World J Stem Cells 2025; 17(7): 104607
- URL: https://www.wjgnet.com/1948-0210/full/v17/i7/104607.htm
- DOI: https://dx.doi.org/10.4252/wjsc.v17.i7.104607


