
















©The Author(s) 2025.
World J Stem Cells. Dec 26, 2025; 17(12): 112100
Published online Dec 26, 2025. doi: 10.4252/wjsc.v17.i12.112100
Published online Dec 26, 2025. doi: 10.4252/wjsc.v17.i12.112100
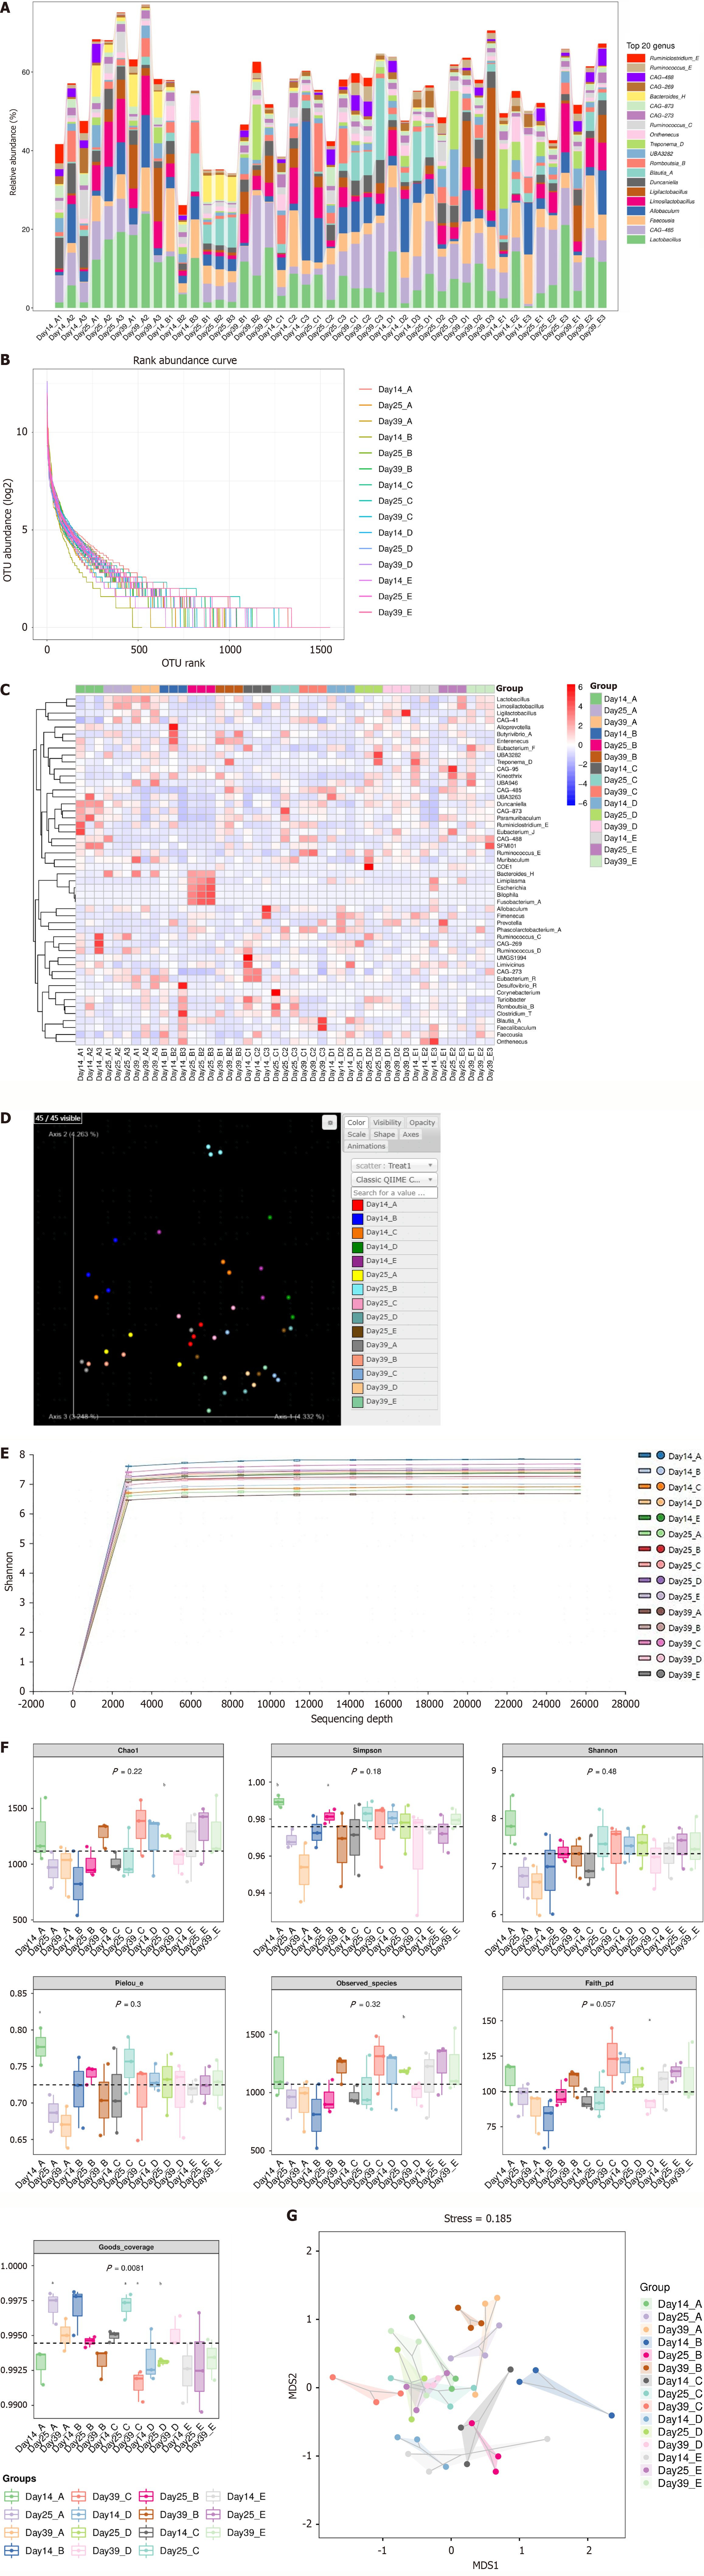
Figure 7 Gut microbial abundance and diversity.
A: Histogram of genus-level species composition; B: Abundance grade plot; C: Heat map of genus-level species composition on days 14, 25, and 39 (three samples per group at each time point) for species clustering; D: Three-dimensional ordering diagram of samples by principal component analysis; E: Sparse curve graph of the alpha diversity index; F: Grouped box plot of the alpha diversity index; G: Two-dimensional sorting diagram by non-metric multidimensional scaling. In each picture, A: Control group; B: Diarrheal irritable bowel syndrome group; C: Human umbilical cord mesenchymal stem cell (hUC-MSC)-low group; D: HUC-MSC-middle group; E: HUC-MSC-high group; Day 14_A: Control group on day 14. aP < 0.05, bP < 0.01.
- Citation: Zhang HM, Zhang Y, Luo GJ, Zhang AX, Li RC, Dong HB, Dong TY, Yu PC, An Y, Li Y. Human umbilical cord mesenchymal stem cells alleviated diarrhea-type irritable bowel syndrome by improving intestinal function. World J Stem Cells 2025; 17(12): 112100
- URL: https://www.wjgnet.com/1948-0210/full/v17/i12/112100.htm
- DOI: https://dx.doi.org/10.4252/wjsc.v17.i12.112100