
















©The Author(s) 2025.
World J Stem Cells. Dec 26, 2025; 17(12): 110894
Published online Dec 26, 2025. doi: 10.4252/wjsc.v17.i12.110894
Published online Dec 26, 2025. doi: 10.4252/wjsc.v17.i12.110894
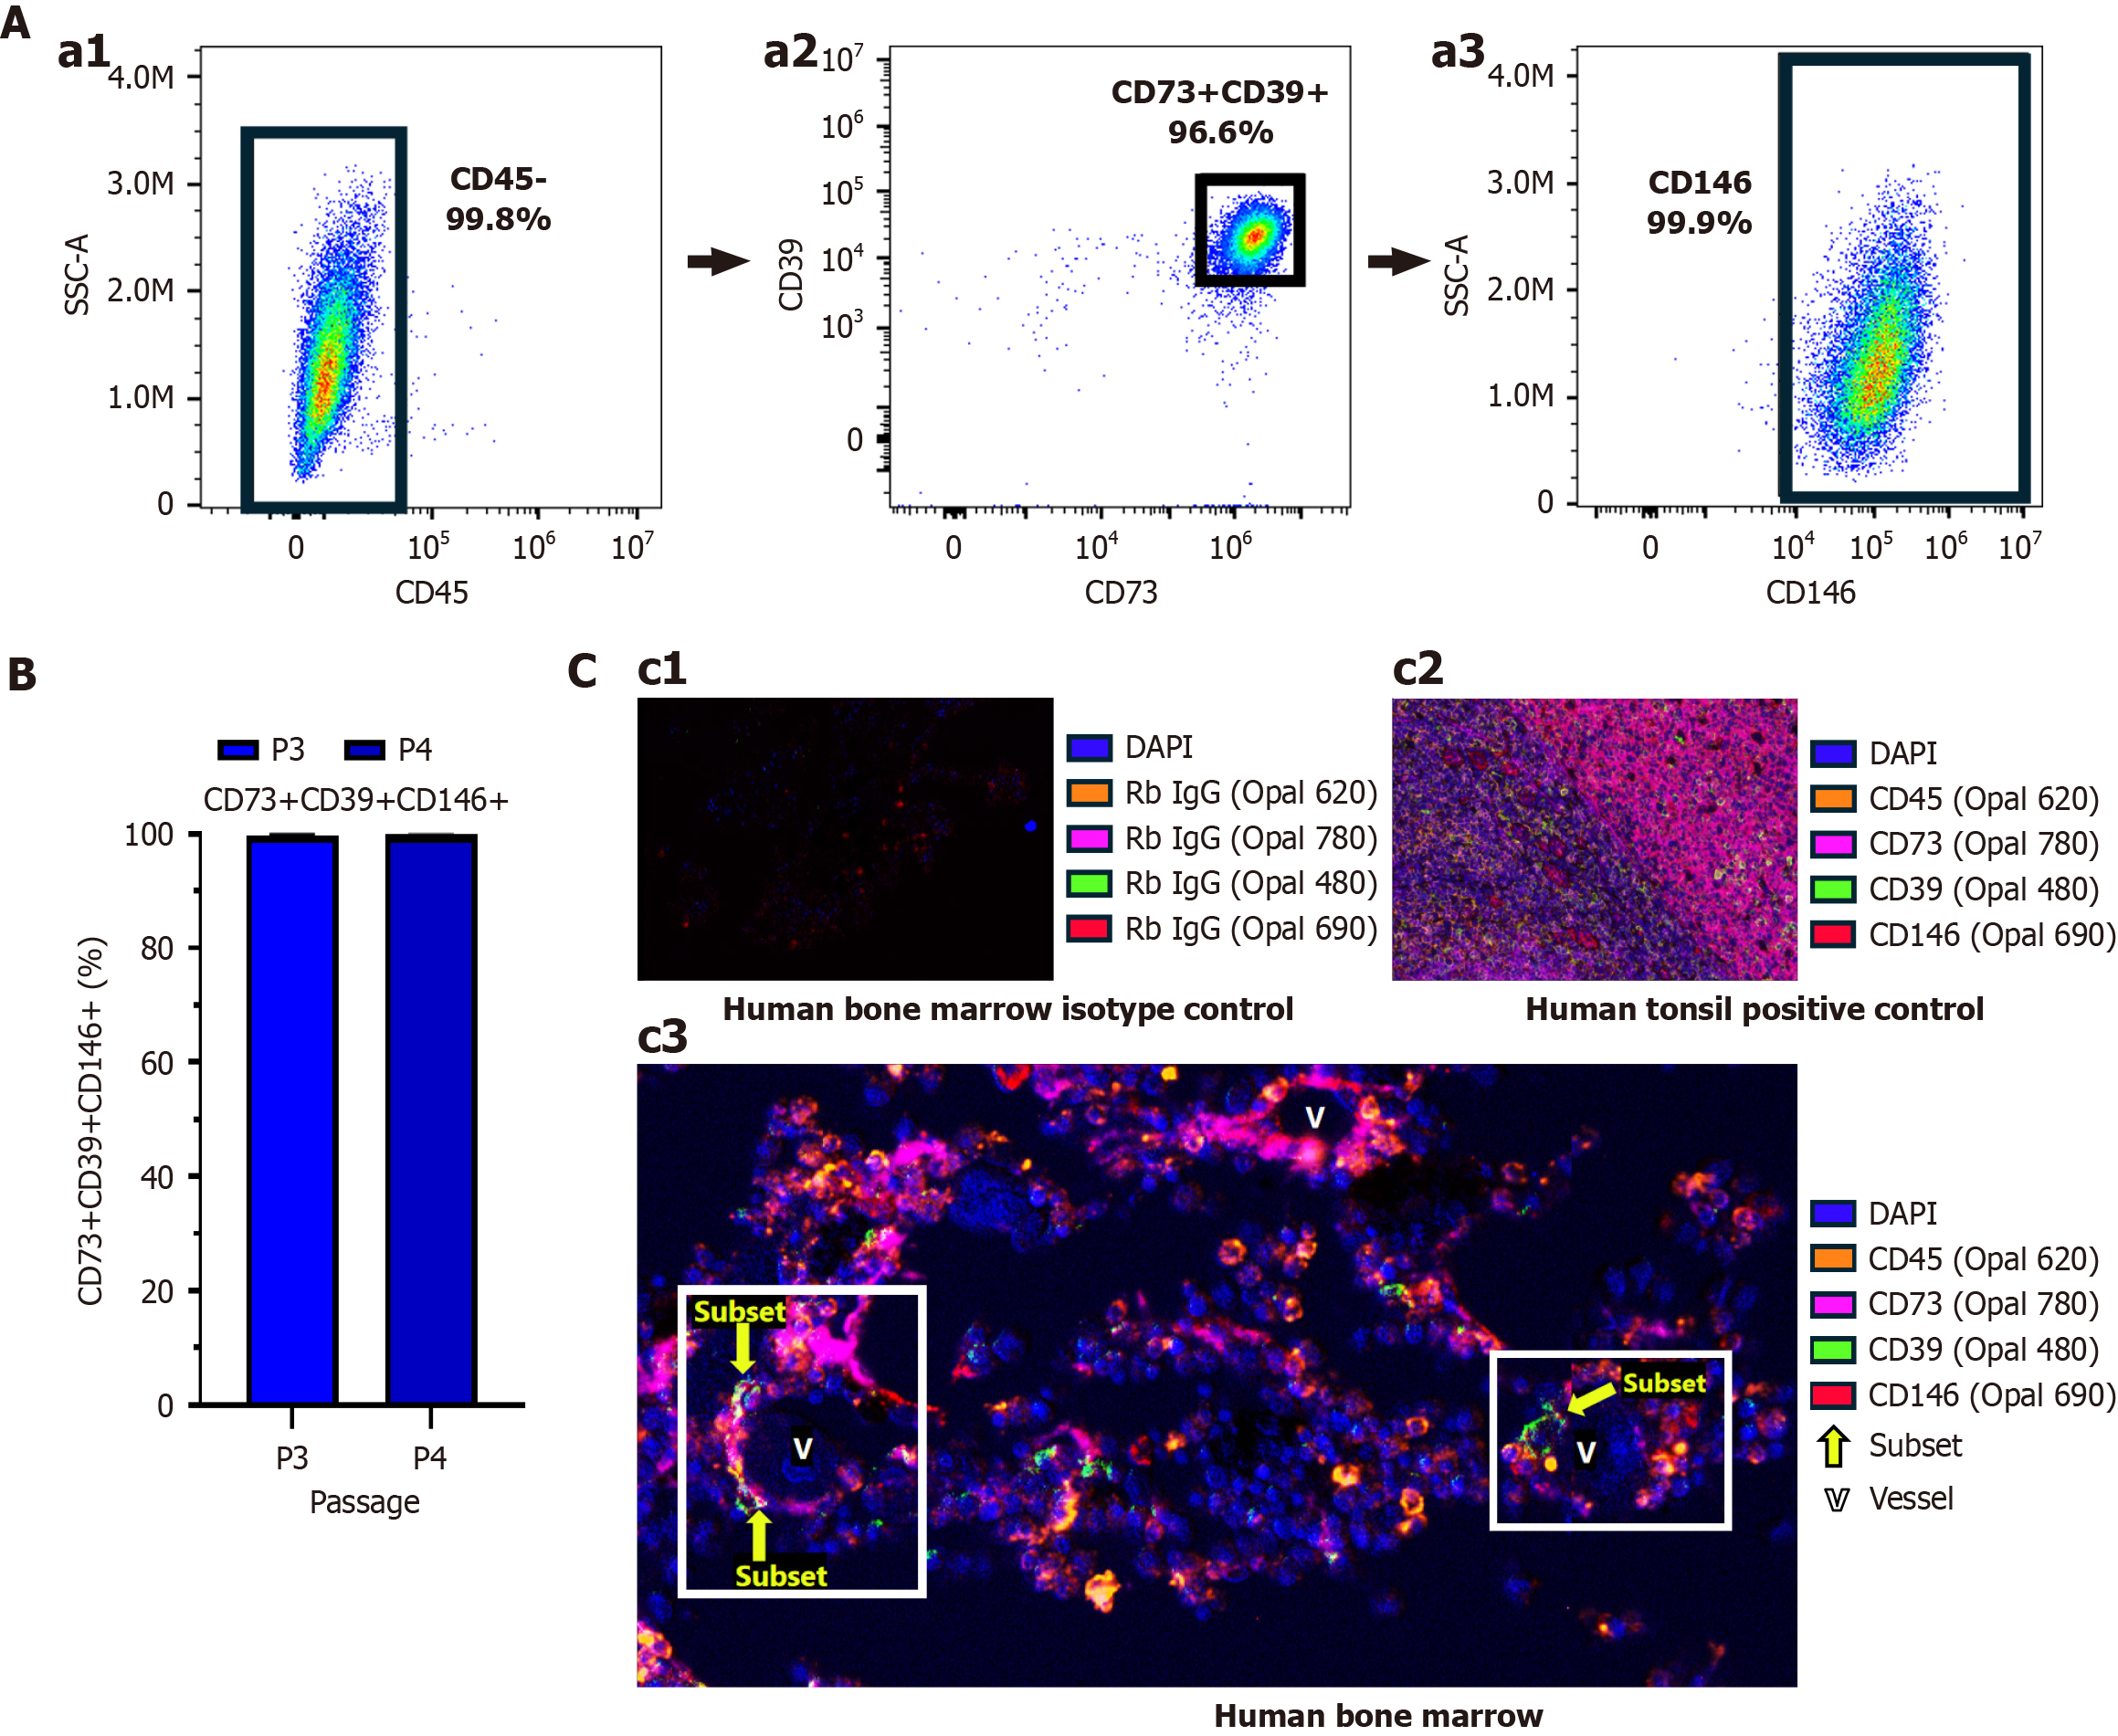
Figure 4 In vitro and in vivo CD146 expression in CD45-CD73+CD39+ subset.
A: Representative flow cytometry analysis showed the entire population of cells copositive for CD73 and CD39 were also positive for CD146 post-sorting and culture (a1-a3); B: Frequency of parent of bone marrow mesenchymal stem cells post sorting for cultured cells for passage 3 and passage 4 (n = 3) with phenotype CD45-CD73+CD39+ and CD45-CD73+CD39+CD146+ as bar graphs are mean ± SD. No significant difference was observed between passage 3 and passage 4; C: Representative immunofluorescence analysis showing colocalization of CD73, CD39, and CD146 in human bone marrow slides. Human bone marrow slide with isotype control was used to verify staining. Image was taken at 40 × (c1). Human tonsils were previously validated for expressing CD45, CD73, CD39, and CD146 and served as a positive control. Image was taken at 40 × (c2). Representative image of human bone marrow slide showing colocalization of subset at perivascular locations where the arrows show locations of CD73, CD39, and CD146 expression and represents the vessel. Image was taken at 40 × (c3).
- Citation: Martin K, Gullo F. Isolation and characterization of CD73+CD39+CD146+ mesenchymal stem cell subset from bone marrow. World J Stem Cells 2025; 17(12): 110894
- URL: https://www.wjgnet.com/1948-0210/full/v17/i12/110894.htm
- DOI: https://dx.doi.org/10.4252/wjsc.v17.i12.110894